How to A/B Test Your Ecommerce Store?

Running an e-commerce store can feel like a guessing game. You have traffic, but your conversion rates are flat. Should you change your "Buy Now" button to green? Offer free shipping instead of 10% off? Or is your headline falling flat?
This is where A/B testing (also called split testing) stops the guessing and starts providing data-driven answers. This guide will walk you through the why and how of experimentation, from foundational strategy to running your first website optimization test.
You will learn:
- The strategic goals behind why we experiment (it's not just about winning).
- The difference between A/B, Multivariate testing (MVT), and A/A tests.
- How to build a powerful test hypothesis.
- How to understand statistical significance and avoid common mistakes (like stopping your test too early).
- A step-by-step process for running conversion rate optimization (CRO) experiments.
Why Experiment?
The hard truth of data-driven improvements is that most new ideas don't work. In fact, studies from large tech companies show that 80-90% of experiments fail to produce a winning result.
The goal of experimentation is not just to "win," but to test for learnings, not just for lift. A well-designed experiment framework helps you at every stage of your ecommerce store development.
- Test to Learn (Product Discovery): In this phase, you are learning what the actual problem is. You use qualitative methods like user interviews, surveys, and competitor analysis to define user pain points.
- Test to Decide (Solution Design): Once you have a defined problem, this phase helps you decide between possible solutions. You might use usability testing or "painted door" tests to see which solution users respond to best.
- Test to Measure (Delivery): In this phase, you use quantitative tests (like A/B testing) to measure and understand if your proposed solution actually solves the problem and impacts your key metrics.
What are different testing methods you can use? (The Hierarchy of Evidence)
Not all data is created equal. When gathering insights for your user experience testing, it's helpful to understand the "Hierarchy of Evidence," which ranks methods by their quality and risk of bias.

Here is the hierarchy, from highest quality (lowest bias) to lowest quality (highest bias):
Systematic reviews and meta-analyses
This is a "study of studies." It collects all high-quality, existing research (like multiple RCTs) on a specific question and synthesizes the results. A meta-analysis uses statistics to combine all the data, creating one powerful, high-confidence conclusion.
Example: A CRO agency publishes a paper analyzing 50 different A/B tests from 30 different stores, concluding that "free shipping" beats "10% off" in 80% of cases, giving you strong confidence to test this idea.
Randomized Controlled Trials (RCTs)
This is the A/B test itself. Users are randomly assigned to a "control" group (A) or a "variation" group (B) to test a specific change. By randomizing, it eliminates selection bias and is the gold standard for proving a cause-and-effect relationship.
Example: Your store randomly shows 50% of visitors a "Buy Now" button and 50% a "Get Yours Now" button, then measures which group converts at a higher rate.
Cohort studies
An observational study that follows groups (cohorts) forward in time to see how their outcomes differ. One group was exposed to a factor (e.g., used a coupon), and the other was not. It's less reliable than an RCT because the groups weren't randomly assigned.
Example: You track all customers who made their first purchase in January. You then compare the 6-month loyalty (repeat purchase rate) of the cohort that used a welcome coupon against the cohort that didn't.
Case-control studies
A retrospective study. It starts with an outcome (e.g., "loyal customers") and looks backward in time to find common factors, comparing them to a "control" group that didn't have the outcome.
Example: You identify a group of "high-value customers" (cases) and a group of "one-time buyers" (controls). You then look at their past activity and find the high-value group was 3x more likely to have used your "live chat" feature on their first visit.
Cross-sectional studies, surveys
A cross-sectional study is an observational "snapshot" of a population at a single, specific point in time.
Think of it as taking a single photograph of a large crowd at a festival. You can see who is in the crowd, what they are wearing, and what they are doing (like eating ice cream) at that exact moment. You can gather a lot of data all at once, but you don't know what they did before the photo or what they will do after.
What It Does
The main goal of this study is to measure the prevalence of two or more variables simultaneously to see if they are correlated (associated). You are looking for patterns in the data you've captured.
The most common form in e-commerce and product research is a survey or an analysis of your database.
Case reports, case studies
A detailed, anecdotal report on a single subject or event. In essence it's a high-definition "story" with a sample size of one. Instead of getting a single piece of data (like conversion rate) from 10,000 users, you get 10,000 pieces of data from one user, one campaign, or one company.
It's a qualitative deep-dive that examines an event in its real-world context. It's great for generating ideas ("hypotheses") but terrible for proving a conclusion because there is no control group.
Example: A marketing blog post titled, "How Firm X Redesigned Their Landing Page and Increased Conversions by 300%." It's an inspiring story, but it's not strong evidence it will work for you.
Mechanistic studies
Mechanistic studies explain the underlying mechanism of why something might work, rather than proving if it actually works in a real-world setting.
Think of it as the "lab science" behind user experience. These studies focus on fundamental principles of human physiology, perception, or psychology, completely separate from your specific business goals like sales or sign-ups.
Their main value is in generating good hypotheses to test later with a high-quality method like an A/B test (an RCT).
Example: A UX research lab uses eye-tracking to show that a user's eye is naturally drawn to bright colors. This suggests a bright CTA might work, but it doesn't prove it will lead to more sales on your specific site.
Editorials, Expert opinion
The lowest level of evidence, based on the belief of a respected expert rather than on data. This is often the source of "best practices" and is infamously known as the HiPPO (Highest Paid Person's Opinion).
Example: A famous marketing guru tweets, "Pop-ups are dead!" or your CEO says, "I have a good feeling about this new headline." These are opinions, and they are exactly what A/B testing is designed to challenge and validate.
For e-commerce optimization strategy, you will primarily use a mix of surveys, user testing, and - most importantly - Randomized Controlled Trials (A/B tests).
When to use experiments?
Different business goals require different types of marketing experiments. Here are four common archetypes for product and growth teams.
| Archetype | Purpose | Common Test Types |
|---|---|---|
| Feature Discovery & Validation | Validate market-fit for new roadmap features before allocating full resources. | Painted Door tests, Validating MVPs, Qualitative Research. |
| De-risk Deployments | Monitor the quality and performance of new code or features as they are released. | Feature Rollouts, Staged Rollouts, Safe Rollbacks. |
| Optimization & Adoption | This is classic CRO. Optimize existing features to improve usage, adoption, or conversion rate. | A/B Tests, MVT, Copy/Design Tests. |
| Blue Sky Research | Answer strategic, "what if" questions about your customers that are evolutionary, not iterative. | Exploratory A/B Testing, Painted Door tests. |
What is A/B Testing?
A/B testing (or split testing) is a Randomized Controlled Trial (RCT). It's a method of comparing two or more versions of a webpage or app screen to see which one performs better.
- You show the original version (the "control" or "A") to one segment of your audience.
- You show the new version (the "variation" or "treatment" or "B") to another segment.
- You then measure which version was more successful at achieving your goal (e.g., a higher conversion rate).
Different Types of Tests: A/B vs. MVT
Before you start, you must decide what you're testing.
- A/B/n Testing (Test One Variable): This is the classic method and the best starting point. You test one variable at a time (e.g., the headline). "A" is the control, "B" is variation 1, "C" is variation 2, etc.. If "C" wins, you know conclusively that the new headline caused the change.
- Multivariate Testing (MVT): This is for high-traffic stores. MVT tests multiple elements at once (e.g., 2 headlines and 3 hero images) to find the winning combination. The downside? It requires massive traffic to test all possible combinations (2x3 = 6 variations) and get a valid result.
- Radical Redesign (Test a New Strategy): This tests two completely different landing page approaches (e.g., your original page vs. a new, super short-form page). You're testing a holistic strategy. You won't know exactly why the new page won (was it the copy? the layout?), but you'll know if the new approach works.
A/A Tests
An A/A test is a crucial part of experiment validation. Instead of testing A vs. B, you test A vs. A - two identical versions.
The goal is to ensure your A/B test tools are working correctly. Both versions should perform identically. If you see a statistically significant "winner," it means your traffic splitting is broken (this is called a Sample Ratio Mismatch) and you cannot trust your test results.
What does statistical significance mean?
This is the most important, and most misunderstood, concept in performance analysis. Statistical significance is a framework for measuring whether your test results are real or just random noise.
To understand it, you must first understand the basics of hypothesis testing.
- The Null Hypothesis (H₀): This is the default assumption, the "status quo." It states that there is no relationship between the variables you are testing. In A/B testing, H₀ is: "The variation (B) is not different from the control (A). Any difference we see in conversions is just random chance."
- The Alternative Hypothesis (H₁): This is the logical opposite, and it's what you are trying to find evidence for. H₁ is: "The variation (B) is different from the control (A). The change we made caused a real effect."
Your goal is to gather enough evidence to reject the null hypothesis (H₀).
The P-Value and Alpha Level
Significance Level (alpha or α) This is the threshold you set before you start the test. It's the maximum risk of a "false positive" (a Type I Error) you are willing to accept. The industry standard for α is 0.05 (or 5%). This means you are willing to accept a 5% chance of thinking you have a winner when you actually don't.
P-Value Is the result you calculate from your test data. The p-value is the probability of observing your results (or even more extreme results) if the null hypothesis (H₀) were true.
You interpret the results by comparing your p-value to your alpha level:
- If p ≤ 0.05: Your result is statistically significant. The data is "very unlikely" to have happened by random chance. You have strong evidence to reject the null hypothesis (H₀) and accept that your variation (H₁) caused a real effect.
- If p > 0.05: Your result is not statistically significant. The data is "likely" to have happened by random chance. You fail to reject the null hypothesis (H₀), meaning your test was inconclusive.
Confidence Level vs. P-Value
Most A/B testing tools don't show you the p-value; they show you the confidence level. The two are just different sides of the same coin: Confidence = 1 - p-value.
The standard 95% confidence threshold you see in A/B test tools is simply the conversion of the standard p-value of 0.05.
| P-Value | Confidence Level | What It Means |
|---|---|---|
| p ≤ 0.05 | ≥ 95% | Statistically Significant. You can reject the null hypothesis. You have a winner. |
| p > 0.05 | < 95% | Not Significant. You must fail to reject the null hypothesis. The test is inconclusive. |
Which confidence level should I use?
Choosing the right confidence level is a strategic trade-off between rigor and actionability. There is no single "correct" level; the right choice depends on your research goals and tolerance for risk.
A higher confidence level (like 99%) reduces your risk of a false positive (thinking you have a winner when you don't), but it may require more time and traffic to reach that high bar. A lower confidence level (like 85%) allows you to get faster, more directional insights, but you accept a higher chance that the results are due to random noise.
| Confidence Level | Use for... |
|---|---|
| 99% | Mission-critical decisions, high investment, or regulatory contexts |
| 95% (standard) | Most consumer research, brand tracking, ad testing |
| 90%–85% | Exploratory research, early-stage concepts |
| 80% | Fast, directional testing, lower risk decisions |
Here is a simple guide to choosing the right level for your test:
- 99% Confidence: Use this for high-stakes decisions. If a test involves a high investment, a mission-critical feature (like a checkout redesign), or regulatory/legal compliance, you need the highest possible certainty before acting.
- 95% Confidence (Standard): This is the most common and recommended level for most consumer research. It's the default for a reason, offering a strong balance between reliability and efficiency. Use it for standard ad testing, brand tracking, and most A/B tests on your site.
- 90%–85% Confidence: Use this for exploratory research. When you're in the early stages, you're looking for promising ideas and directional trends, not final proof. This level is perfect for quickly validating early-stage concepts or capturing weaker signals that might be worth testing again later with more rigor.
- 80% Confidence: Use this for fast, directional testing where the risk is low. If you're testing minor copy changes and just want a quick signal on which version is probably better, 80% can be "good enough" to make a low-risk decision and move on.
The Dangers: Sample Size and Peeking
This is where the theory meets reality. The number one mistake in A/B testing is calling winners early.
- Minimum Sample Size: You must wait until you have enough data (e.g., 100-150 conversions per variation). A large sample size reduces the chance that a small, random fluctuation is mistaken for a real effect.
- Minimum Time: You must also wait for at least 1-2 full weeks to account for different user behavior on weekdays vs. weekends.
- The "Peeking" Problem: Stopping your test the moment it crosses 95% confidence is a common and dangerous error. P-values fluctuate wildly on small sample sizes. This practice, known as "p-hacking", dramatically increases your risk of a false positive (a Type I error) and can lead you to implement a "winner" that was just random noise.
How to A/B Test Your E-commerce Store? A 6-Step Process
Here is a practical framework for experiment planning and execution.
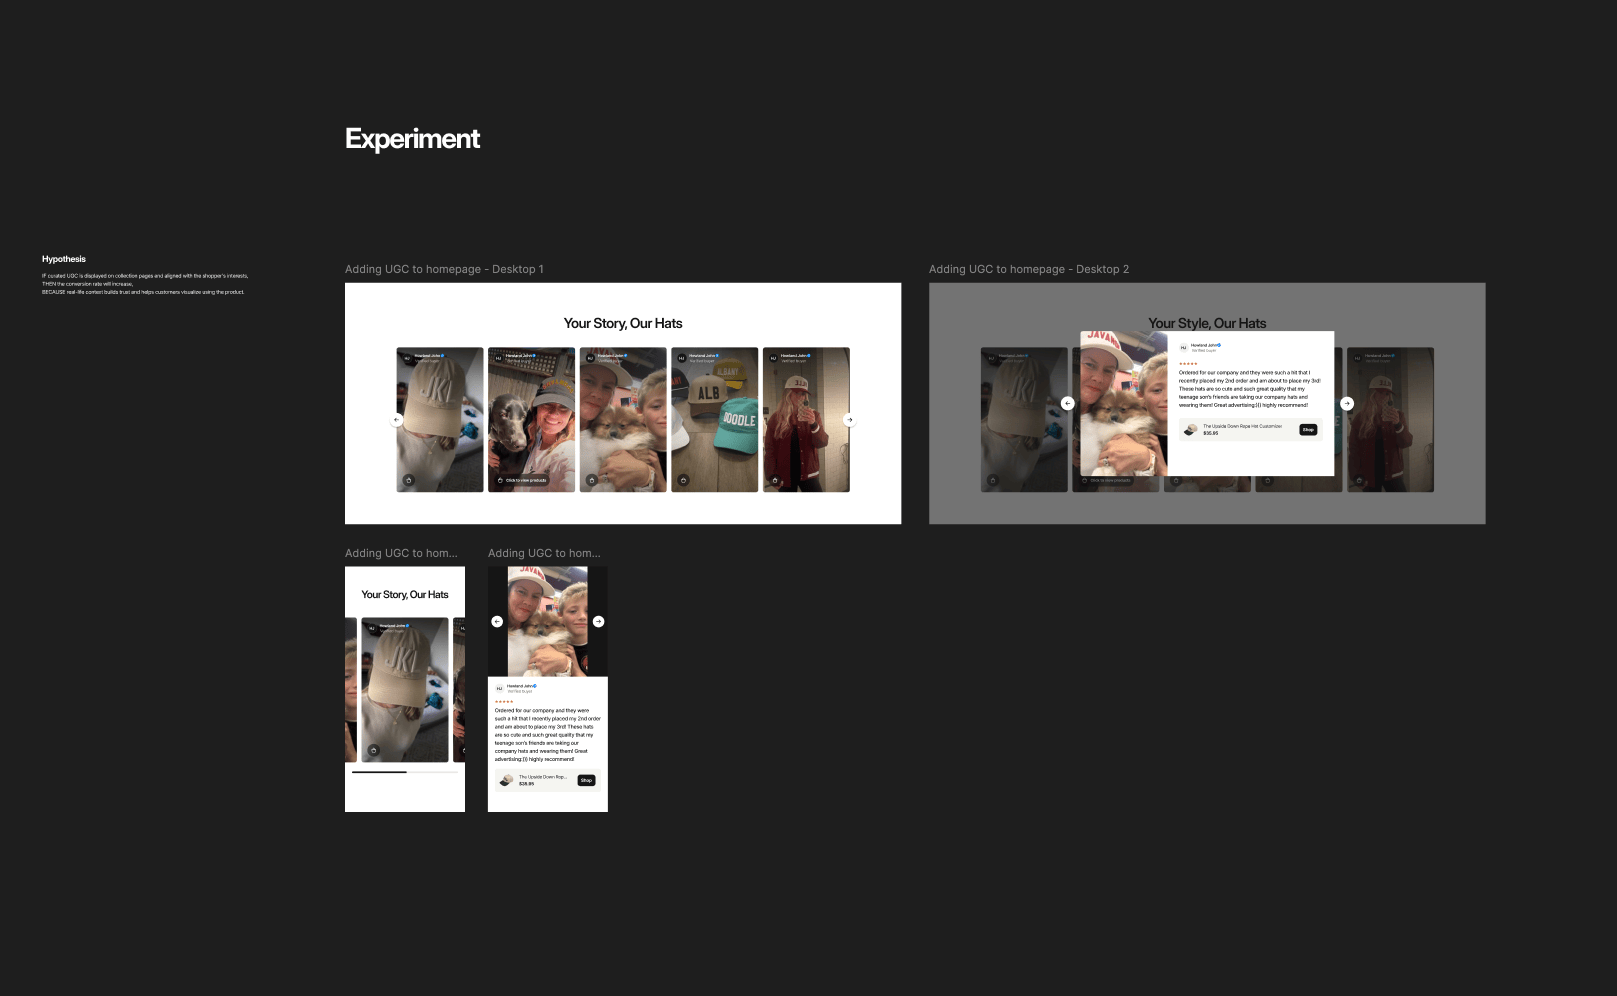
1. Create a Hypothesis
All great experiments begin with a problem. Your hypothesis is your "educated guess" on how to solve it. It should be based on data from your analytics, user testing, or customer surveys.
Use this quick framework:
- Based on... (your data insight)
- We believe... (your proposed change)
- Will result in... (your expected outcome)
Example Hypothesis:
"Based on user session recordings showing hesitation on the product page, we believe adding a 'Buy-Now-Pay-Later' option will result in a 5% increase in 'Add to Cart' clicks."
When deciding what to test, start with high-impact changes. Bigger changes produce clearer signals.
Good first tests:
- Headline & Value Proposition: This is your first impression.
- Core Offer: Test "10% off" vs. "Free shipping".
- Hero Image/Video: Test lifestyle shots vs. product-only shots.
- Primary CTA Copy: Test "Buy Now" vs. "Add to Cart".
- Social Proof: Test testimonials vs. star ratings.
2. Design Variants
This is where your hypothesis comes to life. Designing your "B" version (or "C," "D," etc.) is a critical step that must be guided by your hypothesis.
If your hypothesis is about a single element (e.g., "a clearer CTA will improve clicks"), your variant should only change that one element. This is a classic A/B test.
If your hypothesis is about a larger concept (e.g., "a new layout will reduce friction"), your variant might be a radical redesign where you change multiple things at once (the headline, hero image, and CTA location). This is a valid approach, but you must be clear on what you're testing: the holistic strategy, not a single element.
- For a "Test to Decide": You might design two or three different variations (A/B/n) to see which solution users respond to best (e.g., Control vs. "Free Shipping" banner vs. "10% Off" banner).
- For "Optimization" : You will likely be designing "atomic" changes testing one headline against another, one image against another, or one CTA against another.
3. Implement Variants
This is the technical step of building your designed variations on your e-commerce platform. The goal is to set up the test so that your A/B test software can correctly split traffic between the Control and the Variation(s) and track the results.
Shopify Implementation: Using Shoplift
For a platform like Shopify, you'll use an app like Shoplift to manage your experiment execution. This tool offers several ways to implement your test, depending on the complexity of your change.
Template Test
This method is perfect for testing significant changes on your key template pages (like the homepage, Product Description Page (PDP), collection pages, or the cart).
You create a duplicate of your existing template (e.g., product.test-C.json), create new sections and snippets needed for the design and update new template to match the design.
Shoplift switches the templates on the fly by modifying the url of the page using the ?view=test-C parameter on the pages taking part in the experiment.
Theme Test
This is ideal for testing much larger, site-wide changes. It allows you to test a completely different theme, or more commonly, to test different flows (like a new "mini-cart" pop-up vs. the standard "redirect to cart" page).
This is also the method you'd use to test new global elements like promotional pop-ups or navigation bar changes.
API (JavaScript) Test:
This is a flexible, developer-focused method for making dynamic, client-side changes. Using the JavaScript API, your team can write code to show, hide, or modify specific elements for users in the variation after the page loads.
Pricing Test
This is the highest-leverage test available for maximizing revenue, distinct from standard UX optimization. Instead of testing layout or colors, you are testing your product's price elasticity to find the perfect balance between volume (conversion rate) and value (margin). Because this impacts checkout logic, it requires careful execution to ensure data integrity. Learn exactly how to run and analyze these in our Operator’s Guide to Pricing Experiments.
4. Run the Test Using an A/B Test Tool
You don't need to manually split traffic or calculate p-values. An A/B test software like Shoplift (or other tools like Optimizely or VWO) handles the test execution and experiment tracking.

After your development team has prepared the variants (using the Template, Theme, or API methods described above), you'll configure the experiment in the Shoplift dashboard.
This involves a few critical steps:
- Assign Your Variations: This is where you connect your implementation from Section 3. You'll tell the tool what to show. For a Template Test, you'll specify the URL parameter (e.g.,
?view=test-C) for the variant. For a Theme Test, you'll select the alternate theme you prepared. For an API Test, you'll ensure the test's JavaScript is set to fire. - Define Audience & Traffic: You'll set the traffic allocation, which is typically a 50/50 split between your Control and Variation(s). You can also target the experiment to specific segments, such as "mobile visitors only" or "users from paid search."
- Set Your Goals (Metrics): This is the most important part of the setup. You must define your Primary Goal (also called an Overall Evaluation Criterion or OEC). This is the single metric that will determine if the test is a win or loss (e.g.,
Conversion Rateor% Add to Bag). - Launch and Monitor: Once configured, you'll launch the test. The tool automatically and randomly assigns users to each group, tracks their behavior, and calculates the results and statistical significance in real-time, preparing you for the analysis phase.
5. Retrospective: How to Analyze Your A/B Test Results
Once your test has run for the pre-determined time (e.g., 2 weeks) and hit its sample size (e.g., 150 conversions per variation), it's time to analyze the test results.
The first rule is to go beyond a simple win/loss. The goal is to extract learnings. Every test result, regardless of outcome, falls into one of three categories.
Test is a Winner
The variation beat the control with statistical significance (e.g., 95% confidence).
Action 1: Validate Before You Celebrate.
Look at your secondary and "guardrail" metrics. Did you get the win you wanted, but at a cost? This is a common and critical scenario.
- Scenario 1: The primary metric (clicks) is up, but the secondary metric (purchases) is down. This might mean your new "urgent" call-to-action got more people to click but attracted less-qualified buyers, ultimately hurting the business.
- Scenario 2: The primary metric (clicks) is down, but the secondary metric (purchases) is up. This is a fantastic result! It means your change (e.g., a clearer CTA) repelled "tire-kickers" and attracted only high-intent buyers, leading to more efficient conversions.
Action 2: Segment Your Results.
The overall win is just the headline. The real story is in the segments. Dig deeper into your analytics to see who it won for.
- New vs. Returning Visitors: Did it win for everyone, or did it perform exceptionally well for new users but just okay for returning ones?
- Device Type: Is the win driven entirely by mobile users, while desktop users were unaffected?
- Traffic Source: Did this win with your paid traffic but make no difference to your organic traffic?
Action 3: Expand Your Hypothesis
Now that you have a confirmed learning, what will you do with it?
- Optimize Further: "Can we further optimize this page along the same trend?". If "Free Shipping" beat "10% Off," your next test could be "Free 2-Day Shipping" vs. "Free Shipping."
- Apply Elsewhere: "Can we apply this hypothesis elsewhere on the site/app/service/in the funnel?". If that "Free Shipping" message won on the product page, your next test should be to add it to your main navigation bar or checkout page.
Test is a Loser.
The variation performed statistically worse than the control.
Action 1: Reframe. This is a Success!
This is not a failure; it is a huge learning that just saved you from launching a feature that would have hurt your business.
Imagine this scenario: A major e-commerce marketplace for luxury goods tested a new Virtual Try-On feature for eyewear, hypothesizing it would increase conversions.
The test lost, showing a significant drop in its main metric, "Add to Bag" (–11% to –4%) , and its secondary metric, "Add to wishlist" (–26% to –2%).
The learning, however, was that "the long asset loading time harmed the overall user experience". Users who interacted with the feature for less than 10 seconds had a 30% bounce rate. User testing also revealed that the assets felt "cartoonish" and that for a luxury experience, "low-quality assets... can do more harm than good".
That insight - "our site performance and the high quality of our assets are more important than this feature" - is incredibly valuable.
Action 2: Segment Your Results (Critically Important)
A test that "loses" overall may be hiding a winning segment.
- Imagine your new design lost by 5% overall. You segment the data and find it lost by 15% on desktop (where users hated the new layout) but won by 10% on mobile (where the new layout was much easier to use).
- This "loser" just gave you a massive insight: your mobile users want a different experience, and you now have a validated design for them.
Action 3: Ask "Why?"
Use the "5 Whys" method to find the root cause. Why did users hate it?
- "They didn't click the button." -> Why?
- "They didn't scroll down." -> Why?
- "The new hero image was confusing and didn't look clickable." -> Ah!
- This is where qualitative tools like heatmaps or user recordings can show you the why behind the what.
Action 4: Re-evaluate Your Hypothesis
You were wrong. This is good! You either identified the wrong problem or you proposed the wrong solution. "Explore new hypotheses" and add them to your test backlog.
Your Test is Inconclusive.
This is the most common outcome. After running the test, there is no statistically significant difference. Your tool might show 54% significance and 36,000 visitors remaining.
This is not failure. This is information. It means the change you made was not big enough to have a meaningful impact.
- Cause 1: The Sample Size is Too Small.
- What it looks like: Your test has been running for 5 days, and significance is bouncing all over the place. Or, the test has run longer than estimated (29 days instead of 14), but still hasn't reached significance.
- Action: Check your A/B test tool's calculator. If it says you still need more visitors to detect the minimum effect - continue running your experiment.
- Cause 2: The Impact is Too Small (The "Who Cares?" Result).A "bigger" test would be to make this value proposition impossible to miss, such as testing a bold banner under the price or changing the "Add to Bag" button text to "Add to Bag (Free Shipping)".Other change would be to test the offer itself, not just its visibility, like testing "Free Shipping" (Control) vs. "Free 2-Day Shipping" (Variation) to see if speed is the real motivator.
- What it looks like: You ran the test for 4 full weeks, got plenty of traffic, and... nothing. No difference.
- Action 1: Accept the learning. Your change was too subtle. Your audience does not care about this change. This is valuable! You can now stop the team from ineffectual changes.
- Action 2: "Go Bigger!". If your test of adding a "Free Shipping" icon on the PDP was inconclusive, it means that small visual cue wasn't enough to change user behavior.
- Cause 3: The Data is Unclear (Segments Canceling Out).
- What it looks like: The overall result is flat.
- Action: Segment! This is the "golden nugget". You may discover that your variation lost by 10% with new visitors but won by 10% with returning visitors. The two effects cancelled each other out, leading to an "inconclusive" result. This is a massive learning! Your next test is clear: "Personalize the page to show the variation only to returning visitors."
6. The Iteration Loop: Planning Your Next Test
Iterative testing is the engine of growth. Effective optimization isn't a single test; it's a continuous, data-driven loop that follows a clear cycle: Data ➔ Ideas ➔ Test ➔ New Data.
You start by analyzing Data (analytics, user surveys, heatmaps) to find a problem. This data sparks Ideas for solutions, which you form into a testable hypothesis. You Test that hypothesis by running an experiment, and the result, win, lose, or inconclusive; provides new Data. This new data immediately feeds the next cycle, creating a "circle path from insights to learnings".
This creates a testing roadmap where each experiment builds on the last.
A Hypothetical E-commerce Example:
An e-commerce store sees high traffic but low conversions on its homepage. The initial Data from an analytics review shows a high bounce rate.
- Test 1 (The Subtle Tweak):
- Idea/Hypothesis: The "Shop Now" CTA text in the hero section isn't compelling.
- Test: Change the CTA text to "Explore Our Collection."
- New Data (Result): Inconclusive.
- Learning: Simple CTA text isn't the main friction point.
- Test 2 (The Radical Redesign):
- Idea/Hypothesis: Users are bored by the static hero. They need an inspiring, new layout.
- Test: A radical redesign with a new lifestyle image, new artistic copy ("Find Your Style"), and a different page flow.
- New Data (Result): Loser. Conversions drop significantly.
- Learning: The new layout was distracting. Analyzing this new data shows the original "Shop The Spring Sale" headline (Control) had a much higher click-through than the new, vague "Find Your Style" copy (Variation).
- Test 3 (The Iteration):
- Idea/Hypothesis: Combine the learnings. The layout from Test 2 was cleaner, but the offer-driven headline from the original Control was more powerful.
- Test: Keep the new, cleaner layout (from the "loser") but bring back the original, clear, offer-driven headline ("Shop The Spring Sale").
- New Data (Result): Winner!
This is the power of iteration. They learned from an inconclusive test and a losing test to find a winning combination.
How to Prioritize Your Test Backlog?
After analyzing your results, you'll have a backlog of new test ideas (e.g., "test new mobile design," "personalize for returning users," "test new offer"). You can't test them all at once, so you must prioritize.
A popular prioritization framework is the ICE Score:
- I - Impact: What is the potential impact of this test if it wins? (Testing a checkout funnel step is High-Impact; testing a footer link is Low-Impact).
- C - Confidence: How confident are you this will win? (An idea from a winning segment in a previous test is High-Confidence; a random "blue sky" idea is Low-Confidence).
- E - Ease: How easy is it to implement? (Changing text is Easy; implementing a huge new feature is hard and time consuming).
You and your team score each test idea from 1-10 for each category. The ideas with the highest total scores are what you run next. This builds a structured, data-driven optimization roadmap and stops you from guessing what to test next.


