Post-Purchase Survey Strategy for Ecommerce

What if your best-performing marketing channel is the one you're spending the least on?
Most stores never find out. Every ad platform claims credit for the same sale, and none ask the buyer. A post-purchase survey does. One question on your thank-you page reveals where customers discovered you — and thank-you page surveys earn a 50%+ response rate. Email surveys? 3.24% across 600 ecommerce brands.
Your analytics dashboard gives you quantitative data — clicks, conversions, revenue by channel. A post-purchase survey strategy adds the qualitative layer: why customers bought, what nearly stopped them, and how the experience felt. The numbers tell you what happened. The survey tells you why.
Here's how to build a survey that reshapes your budget, fills your test backlog, and tracks satisfaction.
Three Questions Worth Asking
Surveys with 1-3 questions achieve 83% completion. Add a fourth, and completion drops to 65% These three earn their place
"How did you hear about us?"
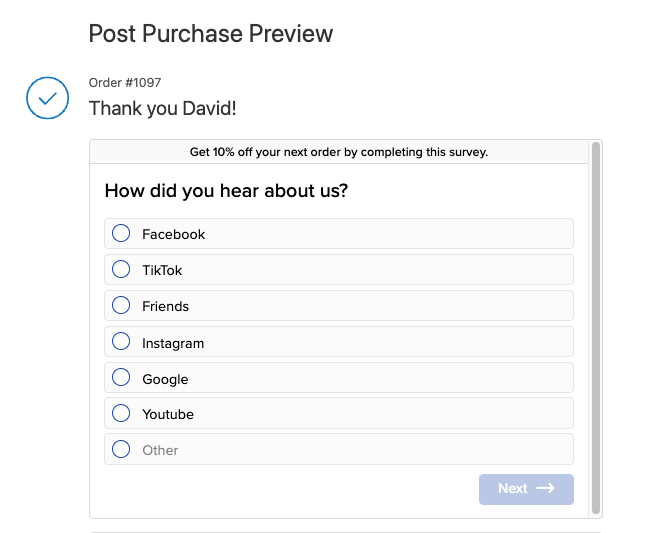
85% of DTC brands ask this question. It exposes the gap between what platforms claim and what buyers report.
Set it up as multiple choice: Instagram, TikTok, Google Search, Friend/Family, Podcast, YouTube, plus a free-text "Other." Multiple choice keeps effort low and data clean.
After a month of responses, you have enough data to test a different budget allocation. When 25% of buyers credit TikTok and your analytics show 4%, that gap tells you where to shift spend next quarter.
The gaps can be dramatic.
Pura Vida's post-purchase surveys revealed 32% of new customers came from TikTok — click-based attribution missed it entirely.
HexClad used survey data to narrow podcast spend from 20 shows to 3-4 top performers and redistributed 85% of budget to new channels.
The pattern holds broadly: software-based attribution and self-reported data diverge by 90% for dark social channels like podcasts, word-of-mouth, and organic TikTok.
How to do this: Export attribution data monthly. Build a table: Channel | Survey % | Platform % | Gap. The largest gap marks the largest misallocation.
"What nearly stopped you from buying today?"
This is the most valuable question for conversion rate optimization.
Buyers name friction that analytics and heatmaps hide. 95% of shoppers say shipping costs impact their purchase decisions. In a study of 6,000 customers, trust and credibility concerns ranked higher than price as a purchase barrier. Your data will echo these themes: shipping costs, missing reviews, unclear return policies, sizing confusion. Thematic coding turns the raw responses into a test backlog.
How to do this: Export a month's responses into a spreadsheet. Read each one. Tag it with a theme: shipping, trust, pricing, product detail, checkout friction. After 200 responses, patterns emerge - 35% mention shipping costs, 20% mention return policies, 15% mention missing reviews.
Rank those themes by frequency. The 35% theme becomes your first A/B test - play with a free shipping threshold, or surface shipping costs earlier in the funnel. The 20% theme becomes your second. You now have a backlog built from customer language.
Review themes monthly. Patterns shift as you fix problems. Shipping complaints drop after you adjust the threshold; trust concerns rise to the top. New data refreshes the backlog every month.
These answers come from people who bought despite the friction. Shoppers who abandoned never reached the thank-you page. If paying customers almost quit over your shipping policy, the customers you lost hit the same wall harder.
"How would you rate your shopping experience? (1-5)"
One number, tracked monthly. This score is your baseline for UX changes you ship.
Check it at the end of each month. Compare it against the previous month. When the score drops, investigate what changed — a new checkout flow, a redesigned product page, a different shipping threshold. When the score rises after a change, you validate the improvement with customer sentiment, not just conversion data.
A CX score dropping two months straight signals a problem. A score holding steady after a redesign tells you the change had no negative effect on experience — even if conversions moved.
Track it alongside micro conversions and key ecommerce metrics. When both CX score and conversions drop together, a recent change caused damage. When CX rises and conversions hold flat, the experience improved but the funnel leaks elsewhere.
What to implement: Start with either attribution or objection mining — whichever gap feels larger. If you distrust your channel data, start with attribution. If you already know where customers come from but conversions plateau, start with objections.
Sequencing: Ask in the Right Order
Lead with a text field and the customer leaves.
Start with attribution. Multiple choice, one tap. The tap commits the customer. A buyer who answers one question almost always answers a second.
Next - objection mining "What nearly stopped you from buying today?" Place this second — the customer already invested one tap and momentum carries them into typing.
Finally - CX score. A 1-5 rating takes one tap. It ends the survey on an effortless action.
Show one question at a time. Stacked questions repel; single questions invite.
You don't have to run all three every time. Instead you can rotate the pool monthly. Week one: attribution plus objections. Week two: attribution plus CX score. Over a quarter, you build a complete dataset without fatiguing any buyer.
How to do this: Map the sequence on paper before you open any tool. Decide which two questions pair together each week. Five minutes of planning saves a rebuild after launch.
Data Into Decisions
Attribution data ages fast. The survey responses from January should have changed your March budget.
Reallocate by Channel
Compare survey-reported channels against platform-reported channels.
One brand discovered YouTube drove a 4.5-5.0x ROAS when Google Analytics reported 0.2-0.3x. The team had underspent on YouTube for months because analytics buried its contribution.
In a second case, Facebook claimed $240K in attributed revenue that surveys attributed to other channels entirely.
How to do this: Export attribution data monthly. Build a table: Channel | Survey % | Platform % | Gap. The largest gap marks the largest misallocation.
Build the Test Backlog
Group "What nearly stopped you?" responses by theme:
- Shipping (cost, speed, threshold) — test messaging, threshold placement
- Trust (return policy, reviews) — test badge placement, review display
- Pricing (expensive, discount expected) — test anchoring, value framing
- Product detail (sizing, materials) — test detail tabs, comparison charts
Rank by frequency. If 40% mention shipping and 5% mention sizing, your first experiment targets shipping.
Track CX Over Time
Track the 1-5 CX score alongside micro conversion rates monthly. When both drop together, a recent change caused damage. When CX rises and conversions hold flat, the experience improved but the funnel leaks elsewhere.
What to implement: Block 30 minutes monthly. Compare survey data against platform analytics. Reallocate budget quarterly. Update the test backlog after every review.
Shopify Tools: Pick One
The tool matters less than the first question you ask with it.
Zigpoll — Free for 100 responses per month. Every tier includes multilingual support, data exports, and unlimited surveys. We use Zigpoll with most clients — it covers what a three-question strategy needs at the lowest price.
KnoCommerce — $19/mo Starter tier gives you one survey, three questions, unlimited responses, conditional logic, and data exports. KnoCommerce caps questions per survey on Starter — enough for this strategy, limiting if you expand later.
Fairing — Free up to 100 orders per month with unlimited questions, LTV analysis, attribution insights, NPS surveys. Fairing ships the richest feature set on its free tier — branching, integrations, and API access from day one.
Decision rule: Start with Zigpoll or Fairing's free tier. Over 500 orders → Fairing's $49/mo plan or Zigpoll's $39/mo Standard, depending on whether you need ad platform integrations.
Install one today. Run your first question for two weeks. Add a second question only after you review and act on the first batch.
Your Customers Already Know What to Fix
One month from now, you will know three things you cannot know today: which channel actually drives your sales, what friction nearly kills your conversions, and whether your last batch of improvements helped. That's one month, three questions, and a free Shopify app.
We use this data to build CRO test backlogs for Shopify stores. Start your first month free.


