How to Run Profitable Pricing Experiments?
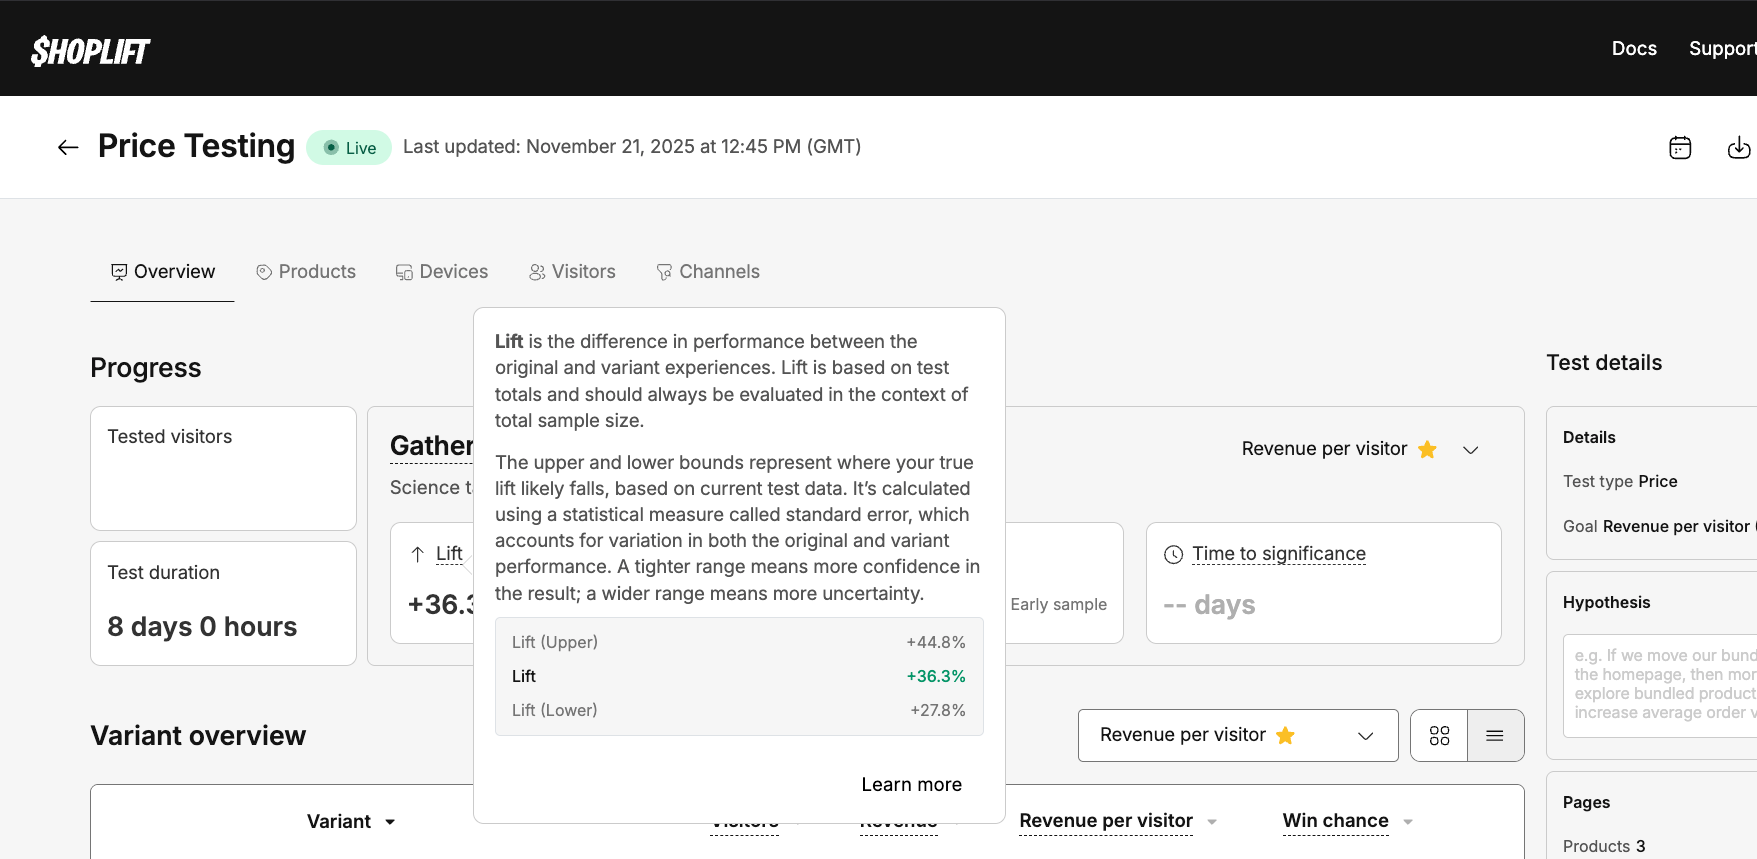
In collaboration with our A/B testing partner Shoplift, we rolled out our first batch of pricing experiments this week.
It triggered a realization that hit me like a ton of bricks: Running pricing experiments is fundamentally different from standard A/B testing.
I find it problematic that most content on this topic focuses entirely on the mechanics of pricing experiments, while ignoring the microeconomics at play.
This superficial approach is dangerous. We need to dig deeper, because interpreting pricing data incorrectly isn't just a failed test; it’s a solvency risk.
When we test a new PDP layout or a complex variant picker UX, the goal is usually friction reduction. We want to smooth the path to purchase or a micro conversion.
The results are extremely limited:
- Variant B improved conversion rate (CVR) or average order value (AOV)? Roll it out.
- Variant A won? Keep it.
- Results are inconclusive? Try choosing a bigger change to test.
Pricing experiments are a different beast entirely. They are not about friction; they are about value perception and unit economics. A pricing test involves a high-stakes tradeoff between Volume (Conversion Rate) and Value (Margin).
You might run a test where conversion rate drops by 10%, yet the experiment is a massive financial success because your net margin increased by 25%. Conversely, you might boost conversion by 20% with a price cut, only to realize you’ve destroyed your profitability.
The Economics of Pricing Experiments: Intent vs. Reality
To run successful pricing experiments, you need to shift your mindset from "CRO" (Conversion Rate Optimization) to "Revenue Optimization."
In a standard UX test, "more orders" equals "better." In a pricing experiment, more orders can actually mean "worse", if those orders are coming at a Customer Acquisition Cost (CAC) that your new lower margin can't support.
The "Willingness to Pay" (WTP)
At the core of every pricing strategy, and therefore a pricing experiment, is Willingness to Pay (WTP)—the maximum amount a customer is willing to part with for your product.
In a perfect world, you would charge every single customer exactly their unique WTP.
Since we can't do that (yet), we can use pricing experiments to find the optimal aggregate price point that maximizes total revenue under the demand curve.
Understanding Price Elasticity: The "Substitute" Factor
Before you set up a pricing experiment in Shoplift or using a different conversion optimization tool, you need a hypothesis rooted in Price Elasticity.
Most people define elasticity simply as "how much demand drops when price rises". However, for a store operator, it is more useful to think of it in terms of Substitutability.
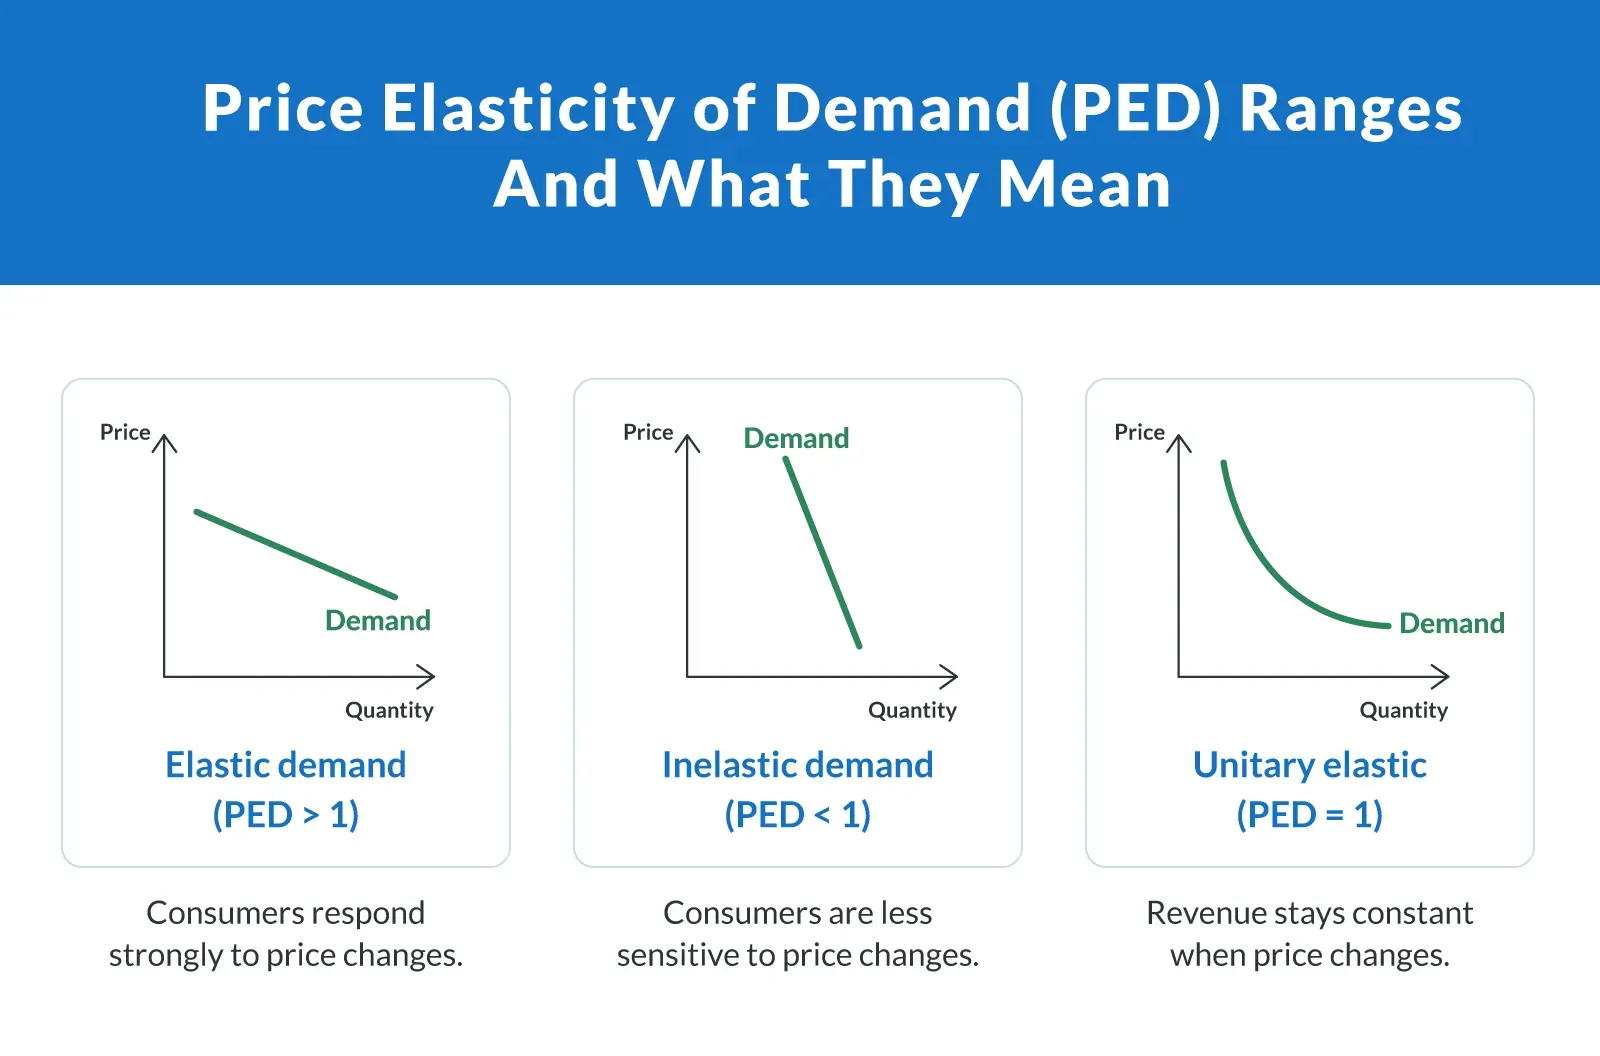
- High Elasticity (The Commodity Trap): If you sell phone chargers, you are in a highly elastic market. If you raise your price by $5, the customer can instantly find 50 other options on Amazon for cheaper. Here, price is the primary decision factor.
- Unitary Elastic (The Profit Pivot): A 10% price increase leads to exactly a 10% drop in volume. Total revenue stays the same, but your profit likely increases (because you are shipping fewer units for the same top-line money). This is often seen in mid-range household items.
- Low Elasticity (The Brand Moat): If you sell a proprietary solution, like a specific supplement blend or a patented ergonomic chair, consumers cannot easily swap you for a generic alternative. The demand is inelastic because the perceived substitute doesn't exist.
Your goal with pricing experiments is to discover your product's elasticity curve.
Are you leaving money on the table because you’re terrified of a 2% drop in conversion rate, unaware that a 10% price hike would result in flat volume?
Pricing Experiments: When to Test "Up" vs. "Down"
Based on your product niche, you should approach pricing with a bias. Here is the economic framework for which direction to test:
1. When to Experiment with Higher Prices (The Veblen Effect)
You should experiment with raising prices if you sell Lifestyle, Beauty, or Proprietary Goods.
In these niches, a higher price often signals higher quality. In economics, this is known as a Veblen Good—a product where demand actually increases as price goes up because the high price confers status or implies superior efficacy.
- The Hypothesis: "Raising the price from $40 to $50 will increase the perceived value of the product, potentially maintaining conversion rates while boosting gross margin by 25%."
- Best for: Fashion, cosmetics, luxury home goods, and art.
2. When to Experiment with Lower Prices (Market Penetration)
You should run a pricing experiment lowering prices if you sell Consumables, Accessories, or High-Competition Goods.
If you are in a "race to the bottom" niche, or if your product requires frequent repurchasing (like coffee or razor blades), the goal is Customer Lifetime Value (LTV), not immediate margin.
- The Hypothesis: "Lowering the entry price will destroy our initial margin, but the increase in acquisition volume will pay off via email retention and repeat purchases over 6 months."
- Best for: Supplements (subscription models), phone accessories, pantry staples.
Strategic Frameworks for Pricing Experiments
Don't just "change the numbers." You need to test a specific economic model. Here are the three main angles to approach your pricing experiments:
Model A: The Margin Hunter (Elasticity Testing)
This is the most common pricing experiment for established brands looking to combat inflation or increase profitability. It relies on the economic principle of Operating Leverage: because your fixed costs (rent, salaries, software) don't change when you raise prices, the additional revenue flows almost entirely to the bottom line.
- The Test: Raising the price from $50 to $55 (a 10% increase).
- The Hypothesis: "Our brand equity is inelastic enough that a 10% price increase will result in less than a 10% drop in volume."
- The "Profit Multiplier" Effect: This is where the math gets exciting. If your current Net Margin is 20%, a 10% price increase (assuming volume stays flat) doesn't just increase profit by 10%—it increases it by 50%. You are expanding the profit wedge without increasing costs.
- The Goal: Find the "ceiling" where demand falls off a cliff. If you raise prices and sales volume stays relatively flat, you have effectively printed free money.
Model B: The Context Game (Anchoring & Decoys)
Price is relative. Customers don't know what something "should" cost in a vacuum; they only know what it costs relative to the options around it. This model tests Reference Prices.
Anchor Pricing (The "Discount" Frame):
Testing a "Compare At" price. Does showing $100 (Strikethrough $150) perform better than just $100?
The Risk: While this often boosts conversion rates for commodity goods, it can backfire for premium brands. A constant "sale" can signal that the product is actually worth the lower price, eroding trust. A pricing experiment reveals if your customers value "deals" (transactional relationship) or "authenticity" (emotional relationship).
The Decoy Effect (The "Up-Sell" Frame):
If you want to sell more of your $100 Standard Bundle, introduce a $180 "Premium Bundle" that offers only marginally more value.
The Logic: The $180 option isn't there to be sold; it exists to make the $100 option look like a "rational bargain" by comparison. You are shifting the comparison from "Buying vs. Not Buying" to "Buying the $100 one vs. the expensive one."
Charm Effect & Psychological Formatting
Testing the "Charm" effect. Does $49.99 actually outperform $50.00?
The Nuance: "Charm pricing" (.99) triggers the "bargain hunting" part of the brain. Round numbers (.00) trigger the "quality seeking" part of the brain. If you sell luxury goods, $50.00 might actually convert better because it feels curated rather than calculated.
Model C: The Volume Play (Cash Flow & Acquisition Efficiency)
This pricing experiment approach can be used when you need to prioritize market share or cash flow over immediate profit efficiency. However, this isn't just about "selling more units"—it's about lowering the barrier to entry for new customers.
- The Test: Lowering prices to drive volume.
- The Business Case: Will the lower margin increase volume enough to offset the loss in profit per unit?
- The Hidden Variable (CAC Impact): This is where most models fail. They forget that Price is a lever for Acquisition Costs.
- Ad Efficiency: If you run Google Shopping or Dynamic Product Ads (Meta/TikTok) where the price is visible, a lower price almost always increases Click-Through Rate (CTR). Higher CTRs often lead to lower Cost Per Click (CPC) on ad platforms.
- The CAC Subsidy: Even if your gross margin drops, your Customer Acquisition Cost (CAC) might drop faster.
- The Math: If a 10% price cut destroys 15% of your margin but improves your Conversion Rate enough to lower your CAC by 30%, you are winning on Net Contribution. You are essentially "buying" customers cheaper by subsidizing the price.
Execution: How to Run the Test Without Breaking the Store
The Tech Stack
You cannot use simple client-side JavaScript tools for pricing experiments.
If the price changes on the product page but reverts in the cart, you will destroy trust and it defeats the purpose. You need a tool that changes the price server-side so it persists through checkout and into the transactional emails.
With Shopify this can be done with Shopify Functions, especially the Cart Transform API, you can implement it as a custom app if you're on Shopify Plus.
The easiest way to differentiate the prices is using custom params added to products in the cart or attribute on the cart, and splitting the traffic between the version that changes the pricing and one that does not.
We utilized Shoplift because it handles the heavy lifting natively within Shopify.
2. Isolating the Variable
Scientific rigor is non-negotiable. If you change multiple variables at once during a pricing experiment, you'll introduce confounding variables, making it impossible to know which change influenced the result.
- Bad Test: New Price ($55) + New Lifestyle Image.
- The Failure: If conversion drops, was it because the price was too high, or because the new image was unappealing? You will never know.
- Good Test: Old Price ($50) vs. New Price ($55).
- The Win: Everything else (images, copy, load speed) remains identical. Any change in performance can be statistically attributed to the price tag alone.
Once you have determined the optimal price, then you can optimize the creative to match leveraging other A/B testing techniques. For example, a higher price point might eventually require "luxurious" photography to convert at scale, but you cannot test the creative and the price simultaneously.
3. The Consistency Rule
As highlighted by payment giants like Stripe, ensuring a consistent experience is critical. If a user sees a price of $50 on their phone, then switches to their desktop and sees $55, they will feel cheated.
Shoplift and similar advanced tools use consistent hashing (based on user ID or IP) to ensure the same user sees the same variant across sessions.
The "Price Agnostic" Strategy for Pricing Experiments
The biggest headache when running pricing experiments is Ad Congruence (the alignment between an advertisement and its surrounding context).
If you display the price in your ads (e.g., "$50" in the image text), you create a variable that messes up your data.
- The Problem: If you change the price on the site but not the ad, users feel deceived (Bait & Switch). If you change the price on the ad too, you now have two variables: Ad Click-Through Rate (CTR) and Website Conversion Rate. Calculating the winner becomes incredibly complex because your Customer Acquisition Cost (CAC) will fluctuate wildly between variants.
- The Fix: Keep your ads "Price Agnostic." Remove the price from your image overlays and ad copy for the duration of the test. Focus the creative on value and benefits, not the dollar amount.
- The Benefit: By doing this, you ensure that the CTR and Cost Per Click (CPC) remain identical for both groups. The only variable that changes is what happens after they land on your site. This invalidates CAC as a variable, allowing you to use the simpler Gross Profit formula below.
The Analysis: Interpreting Results for Profit, Not Just Conversion
This is where the business side is extremely important. When the results come in, you have to look deeper than the dashboard summary.
The Trap of "Winning" Conversion Rates
A "Red" result on conversion rate (e.g., -5%) does not mean the experiment failed. If you raised prices by 20% and conversion dropped by 5%, you have found a massive winner. You are making more money for less work (shipping fewer units).
The Golden Metric: Gross Profit Per Visitor (GPPV)
Note: If you followed the advice above and ran Price Agnostic Ads, you can use this simple formula because your Cost Per Acquisition (CPA) is likely consistent across both groups to analyze the results of your pricing experiment.
To truly analyze pricing experiments, you must export your data and apply your Cost of Goods Sold (COGS).
The Formula:
\[GPPV = (Average Order Value - COGS) \times Conversion Rate\]
Let's look at a hypothetical scenario:
- Product COGS: $40
- Traffic: 10,000 Visitors per variation
| Metric | Variant A (Control) | Variant B (Price Test) |
|---|---|---|
| Price | $100 | $110 |
| Conversion Rate | 3.0% | 2.8% |
| Orders | 300 | 280 |
| Revenue | $30,000 | $30,800 |
| Profit Per Unit | $60 | $70 |
| Total Gross Profit | $18,000 | $19,600 |
The Verdict:
In this scenario, Variant B had fewer orders (20 less) and a lower conversion rate. A basic dashboard might call this a "Loss."
However, the Total Gross Profit is $1,600 higher. Over a year, that’s roughly $83,000 in pure profit added to the bottom line.
The Advanced Metric: Net Profit Contribution (If Ads Were Different)
Use this formula only if you displayed different prices in your ads for each variant.
If your pricing strategy affected your Ad Click-Through Rate (CTR), your CAC is now a variable. You must subtract the ad spend from the profit to see the truth.
The Formula:
\[Net Profit = (Order Value - COGS - CPA) \times Orders\]
- Variant A (Lower Price): Might have lower margins, but a cheaper CPA (easier to get clicks).
- Variant B (Higher Price): Might have higher margins, but a more expensive CPA (harder to get clicks).
If the CPA difference is too high, it can wipe out the gains from the price increase. This is why we strongly recommend the Price Agnostic strategy mentioned in the Execution section—it saves you from this math.
No Traffic? Start Here (The Van Westendorp Method)
What if you don't have enough traffic to run a statistically significant pricing experiment?
In academic circles and pre-launch boardrooms, the gold standard for theoretical pricing is the Van Westendorp Price Sensitivity Meter. It involves asking four specific questions to identify the psychological price floor and ceiling (e.g., "At what price is this so cheap you'd question the quality?").
By plotting these answers, you find the "Indifference Price Point".
The Problem: Stated vs. Revealed Preference
While Van Westendorp is excellent for ballparking a price range for a non-existent product, relying on it for a live Shopify store is dangerous due to Hypothetical Bias.
When a customer answers a survey, they are engaging in cold cognitive processing. When visiting the store, they are navigating a carefully engineered conversion architecture. High-fidelity assets, seamless UX, and social proof triggers create a "halo effect" that often overrides logical price sensitivity.
Conducting pricing experiments through A/B testing measures Revealed Preference—what people actually do when they feel the "pain of paying."
The Verdict: Use Van Westendorp to find out if your product should be $20 or $200. Use A/B testing to find out if it should be $199 or $225.
Conclusion: The Business Case for Courage
The difference between a struggling store and a profitable brand often isn't the product—it's the price. We've moved past the era of "set it and forget it."
It requires nerve to mess with the one lever that directly dictates whether you make money today. But relying on "gut feeling" or copying your competitors is a recipe for mediocrity. Your competitors have different cost structures, different supply chains, and different brand equity.
You now have the frameworks (Elasticity, Anchoring, Volume) and the metrics (GPPV, Net Profit) to make decisions based on math, not fear. Stop guessing what you're worth and let the market tell you.
Frequently Asked Questions
How long should I run a pricing experiment? You should aim to run a pricing experiment for a minimum of two weeks. Buying cycles vary by day of the week, so running a test for less time can skew your data. Additionally, you need to accumulate enough data—typically a few hundred transactions per variant—to ensure the results are statistically significant rather than just random noise.
What is the most important metric for pricing tests? Unlike standard A/B tests, you should not optimize for Conversion Rate alone. The most critical metric is Gross Profit Per Visitor (GPPV). A higher price might lower your conversion rate but significantly increase your total profit dollars. If you only look at conversion rate, you might accidentally kill a winning test that generates more cash for the business.
Can I run pricing experiments if I am running paid ads? Yes, but you need to be careful about Ad Congruence. If your ad shows a price of $50 but the customer lands on a page testing $55, they will feel deceived. The best strategy is to keep your ads "Price Agnostic" by removing specific dollar amounts from your images and copy. This ensures your Customer Acquisition Cost (CAC) remains consistent across both test groups.
When is the best time to run a pricing experiment? The best time is during periods of "normal" business activity. Avoid running baseline pricing tests during high-variance holidays like Black Friday or Christmas, as customer behavior during these times is not indicative of their year-round willingness to pay. However, you should test specifically for seasonal discounts during those seasons if that is your specific hypothesis.
Is it better to test higher or lower prices? This depends on your product's Price Elasticity. If you sell a commodity (high competition), testing lower prices might drive enough volume to increase total profit. If you sell a proprietary or luxury good (brand moat), testing higher prices often yields better returns because demand is inelastic—customers are buying the brand, not just the price tag.
Related Articles
- 27 Shopify Conversion Rate Optimization Tools That Work You cannot run server-side pricing tests with a basic client-side app—you will break your checkout and data integrity. This guide breaks down the professional-grade experimentation stacks (like Shoplift, Convert, and VWO) required to run these tests safely.
- Micro Conversions: Fix Your Shopify Funnel Sometimes a pricing change doesn't immediately kill the sale, but it kills the "Add to Cart." These "micro-conversions" are your early warning signals. Learn how to track the specific process milestones that reveal exactly where your new price point is causing friction before it destroys your monthly revenue.
- How to A/B Test Your Ecommerce Store We focused heavily on the economics of pricing here, but the mechanics of testing remain universal. This guide covers the foundational "Atomic" vs. "Radical" testing frameworks you need to master to ensure your control and variant groups are statistically valid.
- Ecommerce Sales Funnel Optimization: Seven-Figure Guide Pricing is just one lever in your acquisition machine. This guide zooms out to show how price elasticity impacts every stage of the funnel—from the "Awareness" phase (CAC efficiency) to "Retention" (LTV), helping you build a holistic strategy that goes beyond a single test.
- Ready to turn more of your current traffic into customers? Discover how we can help with ourconversion rate optimization services.
