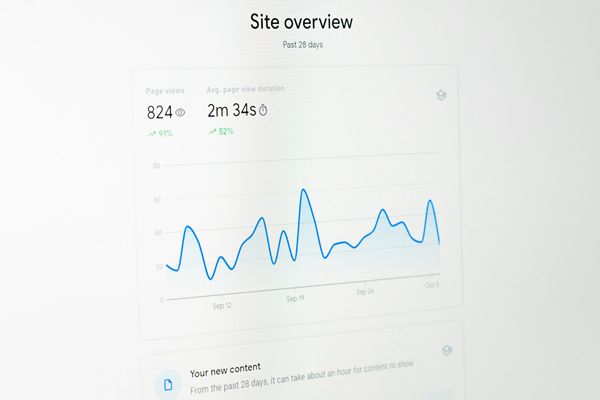
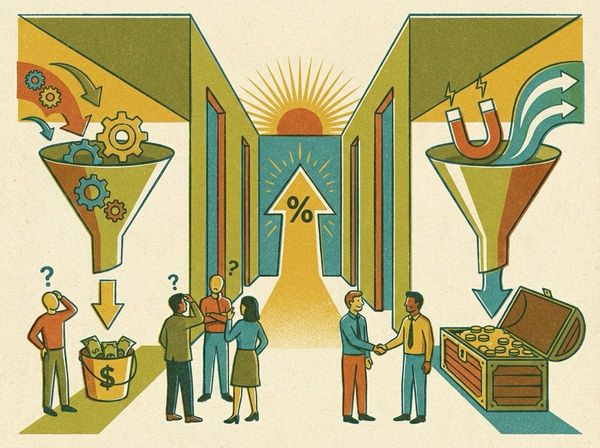
Step-by-Step Guide to Shopify Funnel Tracking

Tracking your Shopify store's funnel helps you understand how customers move from browsing to purchasing. This process identifies where potential buyers drop off and provides actionable insights to improve conversions. Here’s what you need to know:
- Funnel tracking monitors customer behavior at key stages: homepage visits, product views, adding to cart, checkout, and purchase.
- Tools like Google Analytics 4 (GA4), Amplitude, and Funnelytics help you track and analyze these steps effectively.
- Shopify’s Custom Pixel feature simplifies integrating tracking scripts without altering your store’s code.
- Key metrics to monitor include conversion rates, cart abandonment, average order value, and revenue per visitor.
Why It Matters
Funnel tracking breaks down your store’s performance into measurable steps, pinpointing weak areas like checkout drop-offs or product page exits. By addressing these issues, you can make data-driven decisions to boost sales and optimize the customer journey.
Tools You’ll Need
- Google Analytics 4 (GA4) for tracking e-commerce events.
- Amplitude for detailed user journey analysis.
- Funnelytics for visual funnel mapping.
How to Set Up
- GA4 Integration: Connect Google Analytics through Shopify’s admin panel and enable enhanced e-commerce tracking.
- Amplitude Setup: Use Shopify’s Custom Pixel to integrate Amplitude’s JavaScript SDK for tracking user actions.
- Funnelytics Mapping: Install Funnelytics’ tracking script and create a visual funnel to analyze traffic sources and drop-offs.
Optimizing Your Funnel
- Use heat maps and session recordings to identify friction points.
- Run A/B tests to experiment with changes like checkout flow or product page design.
- Monitor metrics like conversion rates and time to purchase to measure success.
For expert help, services like Clean Commit offer tailored Shopify conversion rate optimization services, with a 30-day trial to test their approach.
Setup Shopify Checkout Goals in Google Analytics & View Funnels
Prerequisites for Setting Up Funnel Tracking
Before diving into the setup process, it’s essential to gather the right tools and credentials. Being prepared will make configuring your Shopify funnel tracking much smoother and more efficient. This section outlines everything you need to get started.
Tools and Accounts You’ll Need
To track your funnels effectively, you’ll rely on several powerful tools. Here’s what you should have ready:
- Google Analytics 4 (GA4): This platform offers comprehensive tracking and integrates seamlessly with Shopify. Make sure you have an active Google account and have already set up your GA4 property.
- Amplitude: Known for its detailed funnel visualization and user journey mapping, Amplitude is a great choice for businesses of all sizes. Their free plan supports up to 10 million events per month, making it an accessible option. Create an account and secure your API key before proceeding.
- Funnelytics: This tool is ideal for visually mapping your conversion funnels. While it requires a paid subscription, its intuitive interface simplifies the process of analyzing customer journeys and sharing insights with your team.
In addition to these platforms, ensure you have access to your Shopify admin panel with the necessary permissions to install apps and adjust settings. You’ll also need your store’s domain details and any existing tracking codes you may have implemented.
Shopify’s Custom Pixel Setup: What You Need to Know
Once your tools are ready, the next step is integrating Shopify’s custom pixel feature for effective and secure tracking.
Shopify’s custom pixel allows you to implement tracking scripts across your store, including checkout and post-purchase pages, without altering your theme code directly. This feature operates in a Lax sandbox environment, which enhances security and simplifies maintenance.
As Shopify transitions away from older features like checkout.liquid and other Liquid templates, the custom pixel has become the go-to method for adding tracking scripts. It works seamlessly with standard Shopify events such as page_viewed, product_added_to_cart, checkout_started, and checkout_completed.
Before setting up your custom pixel, ensure you have the JavaScript code ready for your chosen tools - whether it’s your GA4 measurement ID, the Funnelytics script, or code snippets from other platforms. Testing these scripts beforehand will help avoid any hiccups during implementation.
Permissions and Access Requirements
To manage custom pixels and complete the setup, you’ll need admin-level permissions in your Shopify store. Store owners or staff accounts with full permissions can handle this, but collaborator accounts may face restrictions.
If you’re working with a development team or agency, double-check that they have the appropriate access. Some integrations may require additional permissions for app installations or connecting third-party tools.
Before implementing the custom pixel, it’s critical to remove any existing tracking code to avoid duplicate events. Check the following areas:
- The
theme.liquidfile - Any
checkout.liquidfiles (for Shopify Plus users) - The Additional Scripts section in your checkout settings
Cleaning up old tracking code ensures accurate data collection and prevents inflated metrics that could lead to misleading insights.
Lastly, confirm that your Shopify plan supports the features you need. While basic funnel tracking works on all Shopify plans, advanced features and some third-party integrations may require Shopify Plus or specific app subscriptions. Keep your login credentials and API keys for all analytics platforms handy to streamline the process.
Step-by-Step Setup for Funnel Tracking on Shopify
Ready to get your funnel tracking up and running on Shopify? With the tools and permissions in place, here's how to set up tracking for each platform.
Integrating Google Analytics 4 with Shopify
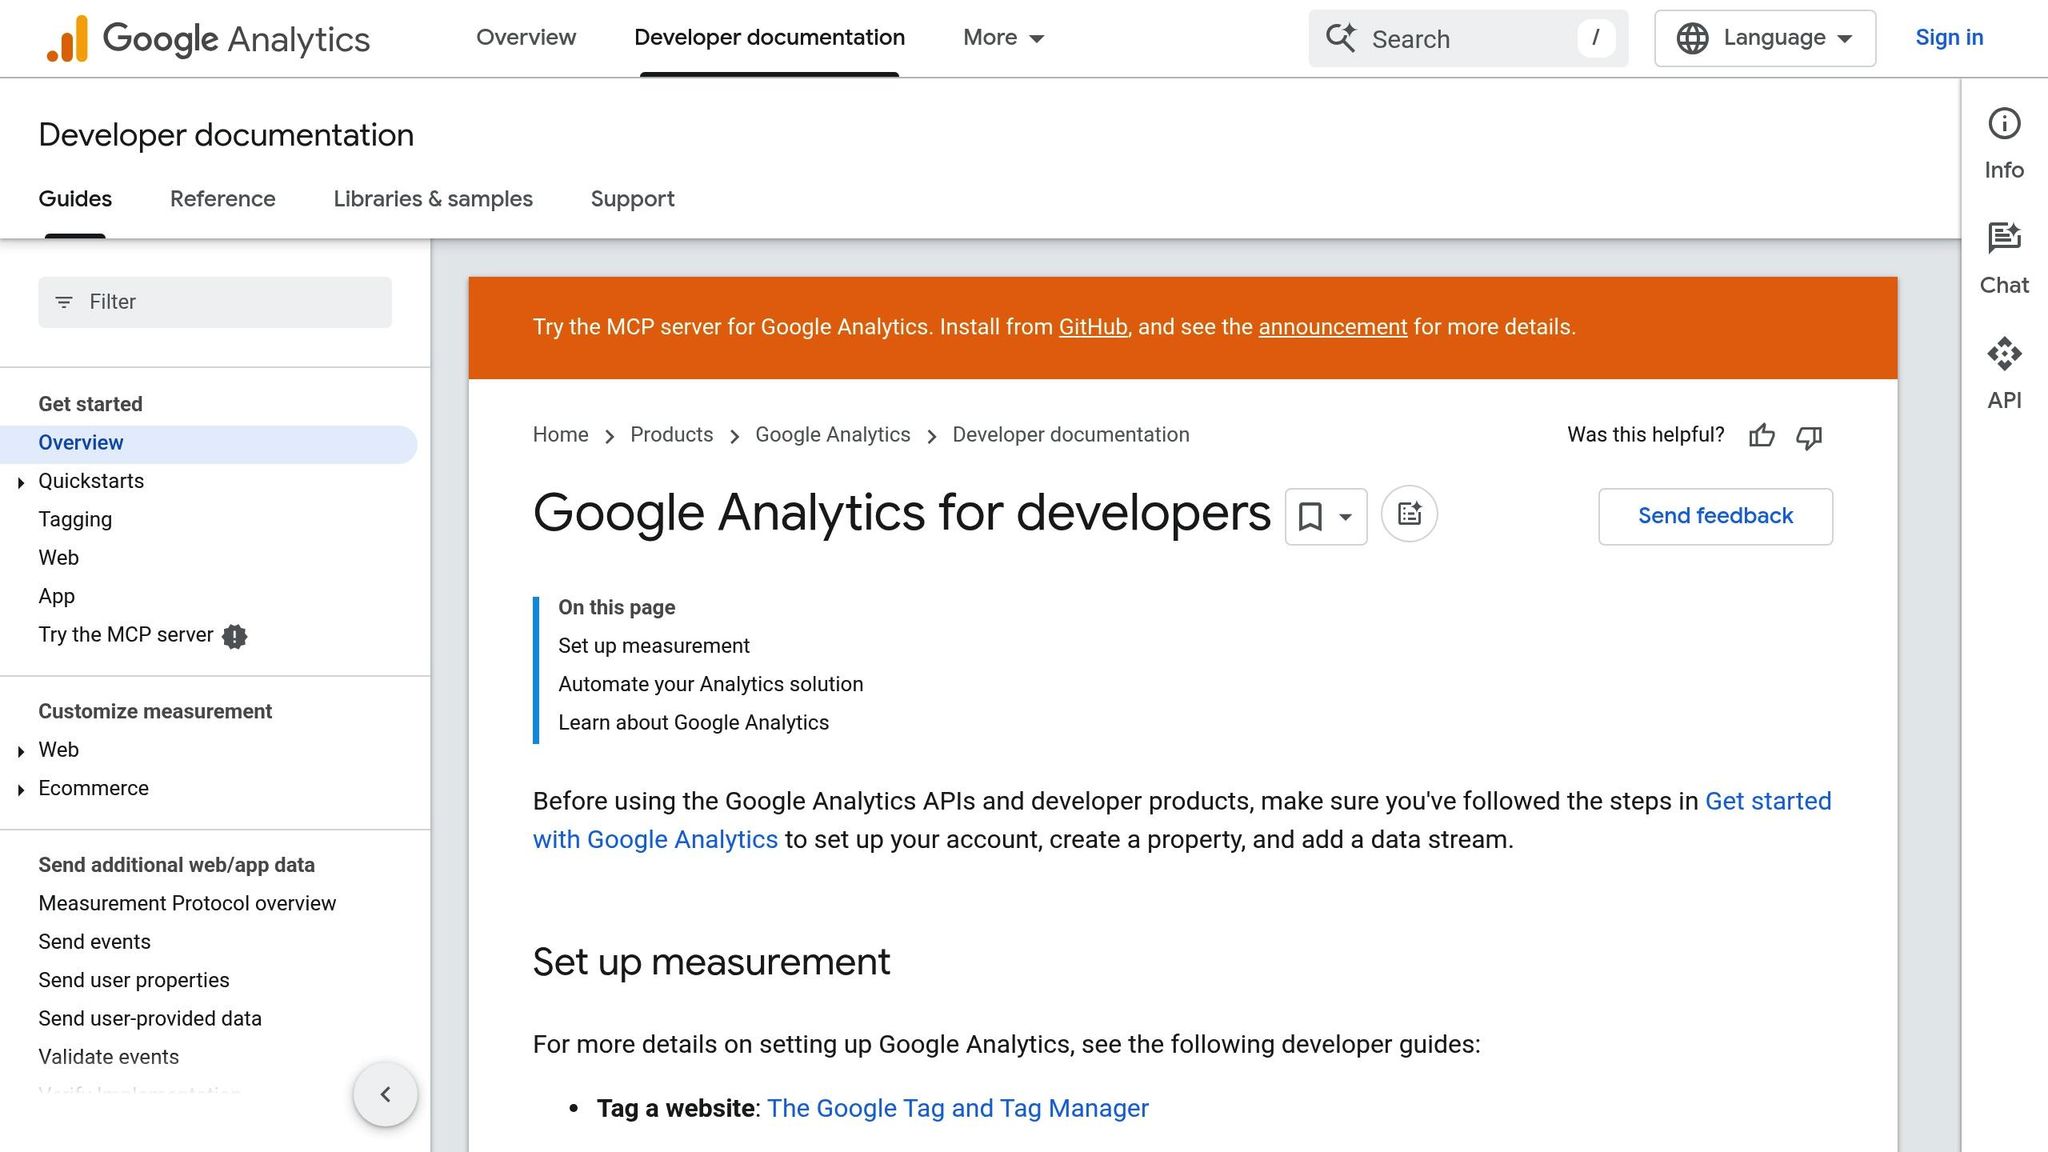
Google Analytics 4 (GA4) makes tracking on Shopify straightforward, thanks to Shopify's built-in GA4 support.
Start by opening your Shopify admin and navigating to Settings > Apps and sales channels. Locate the Google channel in your installed sales channels. If it's not there, you can install it for free from the Shopify App Store. This channel manages both Google Analytics and Google Ads integrations.
Once in the Google channel, click Connect Google Analytics. Log in to your Google account and grant the required permissions. Select the GA4 property you set up earlier from the dropdown menu. If your property doesn't appear, double-check that you're signed into the correct Google account.
After connecting, confirm that enhanced e-commerce tracking is enabled. Go to your GA4 property, then navigate to Configure > Events. Within 24–48 hours, you should see events like page_view, add_to_cart, begin_checkout, and purchase. The purchase event is especially critical as it tracks your revenue and conversions.
For more advanced tracking, you can create custom events using Shopify's Custom Pixel feature. Go to Settings > Customer events > Custom pixels in your Shopify admin. Here, you can set up a new pixel and include your GA4 measurement code to track additional actions, such as newsletter signups or product reviews, that aren't part of the standard integration.
To test your setup, make a purchase in test mode. Within a day, transaction data should appear in GA4 under Reports > Monetization > E-commerce purchases.
Next, it's time to integrate Amplitude for deeper funnel insights.
Setting Up Amplitude for Funnel Tracking
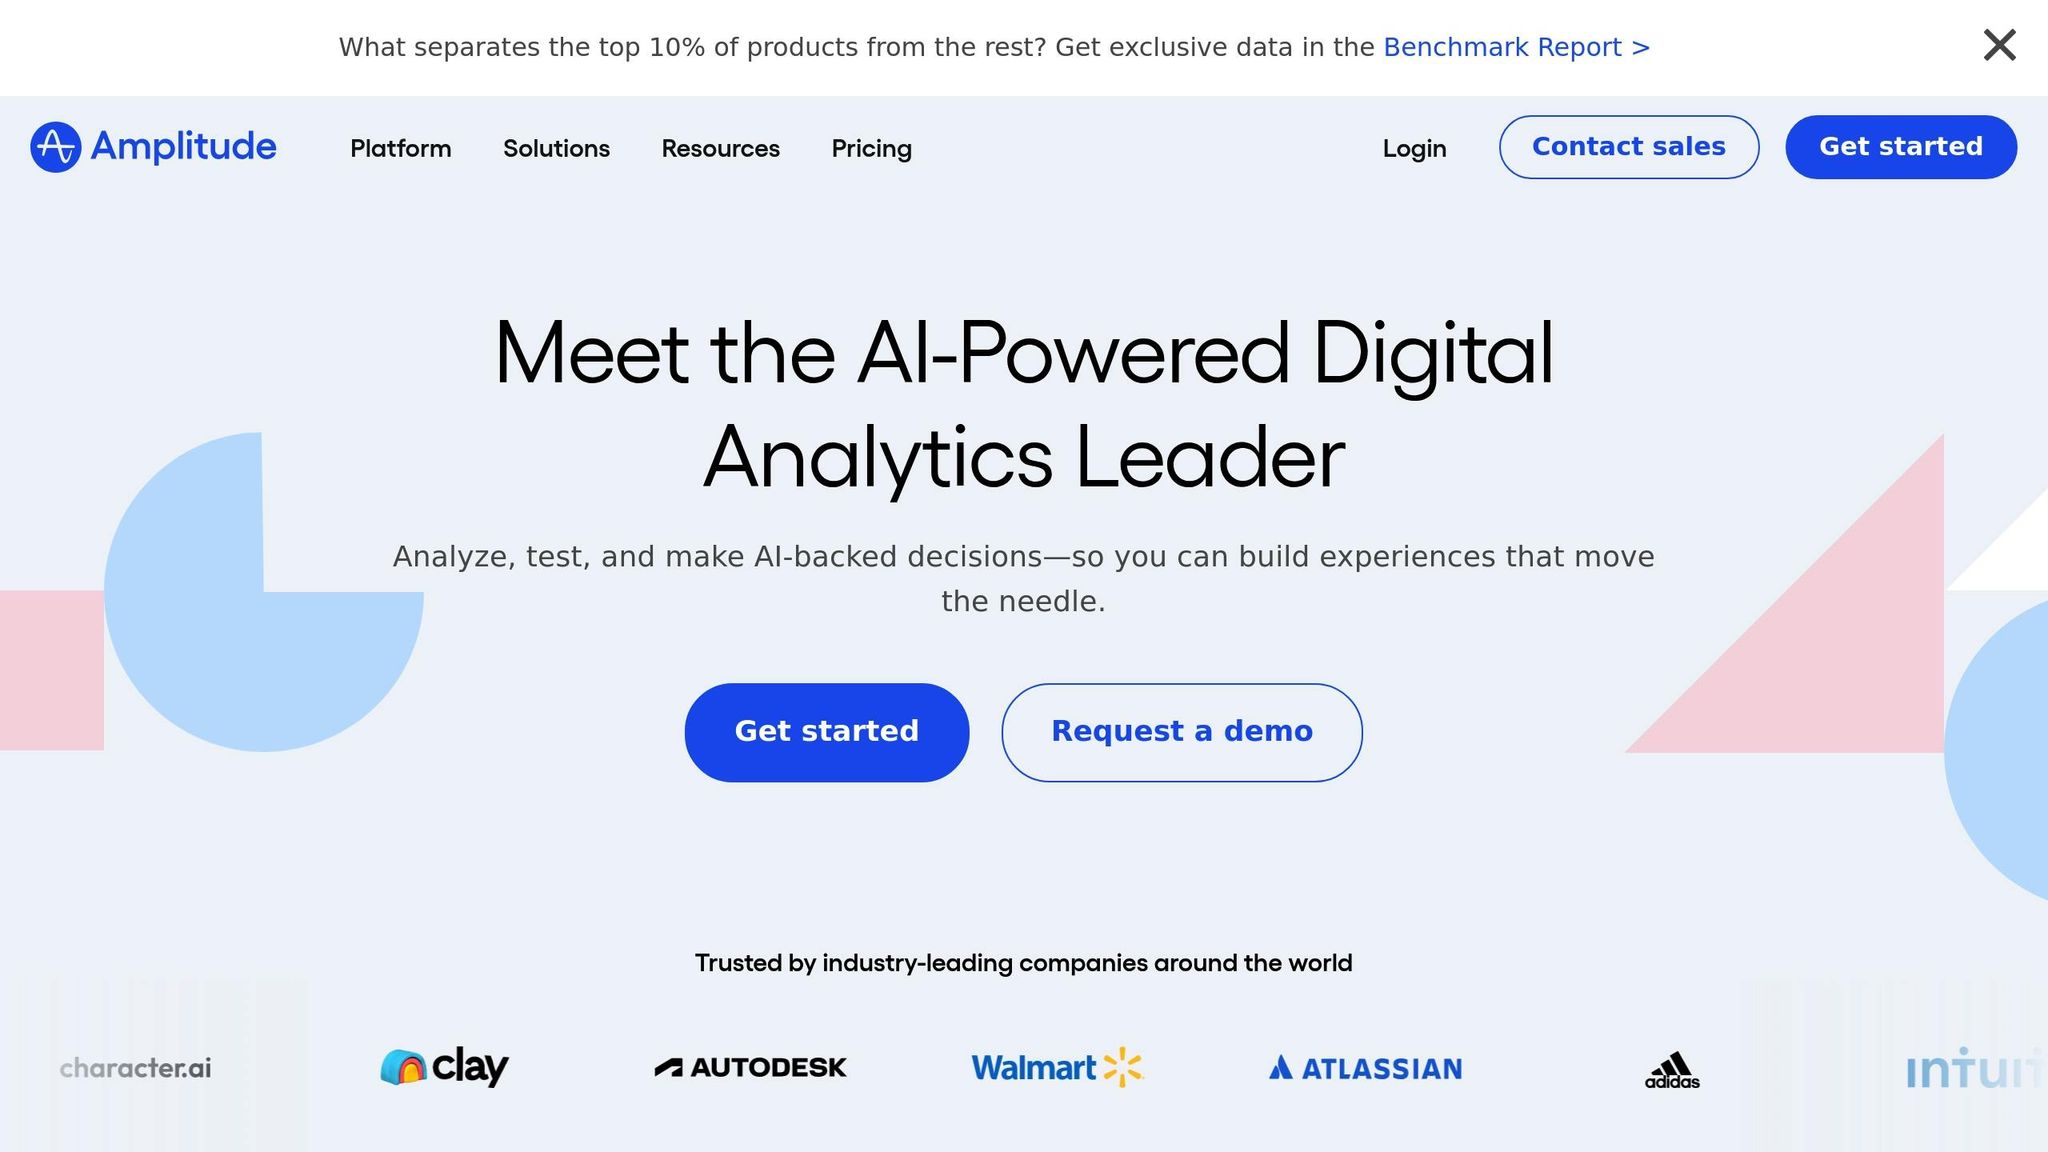
Amplitude offers powerful tools for analyzing user journeys and visualizing funnels.
Begin by logging into Amplitude and creating a new project for your Shopify store. Note down your API key, which you’ll find under Settings > Project Settings > General.
The easiest way to integrate Amplitude with Shopify is by using their JavaScript SDK with Custom Pixels. In Shopify, go to Settings > Customer events > Custom pixels and create a new pixel named "Amplitude Tracking."
Paste the Amplitude JavaScript snippet into the custom pixel editor, replacing the placeholder API key with your actual one. The basic setup should include initialization and automatic page view tracking.
Configure the pixel to track key actions such as product views, adding items to the cart, starting checkout, and completing purchases. Be sure to include relevant details like product name, price, category, and user ID when available.
You can also set up user properties, such as customer type (new versus returning), location, and device type. These insights are incredibly helpful for segmenting and analyzing your funnel performance.
Test the setup by navigating through your store and performing actions like adding items to the cart or completing a purchase. The events should show up in Amplitude's User Look-Up section within minutes. Use the Live Events feature to monitor real-time tracking and confirm everything is working as expected.
To analyze your funnel, head to Analytics > Funnel Analysis in Amplitude. Define the steps of your funnel, such as Product View → Add to Cart → Checkout Started → Purchase Completed. This will give you a clear view of where customers might be dropping off.
Using Funnelytics for Visual Funnel Mapping
Once your event data is being tracked, you can create a visual representation of your funnel using Funnelytics.
Log into Funnelytics and set up a new funnel map for your Shopify store. Start by selecting a template that aligns with your store’s structure.
To integrate Funnelytics with Shopify, install their tracking script through Custom Pixels. In Shopify, go to Settings > Customer events > Custom pixels, and create a new pixel for Funnelytics.
In your Funnelytics dashboard, go to Settings > Tracking to find your unique tracking code. Copy the code and paste it into your Shopify custom pixel. This script will automatically track page views and standard e-commerce events. You can also customize it to track specific actions unique to your store.
In Funnelytics' visual editor, design your funnel by dragging and dropping elements to reflect your customer journey. Start with broad stages like Traffic Sources, Product Pages, Cart, Checkout, and Thank You Page. Then, refine these stages to match your store’s specific flow.
For tracking traffic sources, configure UTM parameters and referrer tracking. This allows Funnelytics to show how different marketing channels contribute to your funnel, not just at the initial touchpoint but throughout the entire journey.
Ensure your purchase events are tagged with transaction values. This step is crucial for tracking not just conversion rates but also the revenue generated at each stage.
You can also take advantage of Funnelytics' A/B testing feature to compare the performance of different funnel variations. For example, test different product page layouts or checkout flows by creating separate funnel maps.
Test your setup by walking through your store’s customer journey while monitoring Funnelytics’ live data feed. Each step should register in real-time, confirming that tracking is working across devices and browsers.
Funnelytics' visual approach is particularly useful for sharing insights with stakeholders. Its clear representation of customer flow and drop-off points makes it easier to identify areas for improvement and communicate potential changes effectively.
Analyzing and Interpreting Funnel Data
Once your funnel tracking is set up, the real work begins: making sense of the data and using it to refine your conversion strategies. With the right insights, you can pinpoint bottlenecks and uncover areas for improvement.
Accessing Funnel Reports
Google Analytics 4 (GA4) offers several tools to help you analyze funnel performance. Start by navigating to Reports > Monetization > E-commerce purchases for an overview of your sales funnel. For a deeper dive, use the Path exploration report under the Explore tab to map out user actions. The Funnel exploration tool is particularly useful for visualizing each step in your conversion process.
To track key actions, visit Reports > Engagement > Events. Here, you’ll find data on events like view_item, add_to_cart, begin_checkout, and purchase. The Conversions section highlights which events are driving the most value for your business.
If you’re using Shopify, the admin dashboard includes an online conversion funnel report for quick access to key metrics.
Other platforms, like Amplitude, simplify this process with tools like Funnel Analysis, which lets you define specific steps (e.g., Product Viewed → Added to Cart → Checkout Started → Purchase Completed). It calculates conversion rates for each step and flags where users drop off. Similarly, Funnelytics offers interactive funnel maps that display traffic volume, conversion rates, and revenue attribution in real time. Clicking on any element reveals detailed metrics, giving you a clear picture of your customer journey.
Once you’ve accessed these reports, the next step is to focus on the metrics that matter most.
Key Metrics to Monitor
To optimize your funnel, you need to track more than just the overall conversion rate. Breaking it down step by step can help you zero in on specific areas that need attention. Here are some key metrics to watch:
- Step-by-step conversion rates: These reveal how effectively users move through each stage of the funnel. Identifying drop-off points is crucial for making targeted improvements.
- Cart abandonment rate: This metric varies by industry and device type, but unusual spikes could indicate issues that need fixing.
- Average order value (AOV): Comparing AOV across different entry points can help you identify opportunities to increase revenue.
- Time to conversion: Understanding how long it takes for customers to complete a purchase can guide your retargeting and follow-up strategies.
- Revenue per visitor (RPV): By dividing total revenue by the number of visitors, you can measure how effectively your funnel turns traffic into income.
- Exit rates by page: High exit rates on specific pages often signal problems with content, design, or user experience that need to be addressed.
Visualizing and Comparing Funnel Data
Numbers alone don’t always tell the whole story. Visual tools can help you spot trends and patterns more easily. For example:
- Google Analytics 4 comparison features: These allow you to analyze funnel performance across different time periods, traffic sources, or device types. This helps you identify areas that need targeted optimization.
- Cohort analysis: Platforms like Amplitude let you group users by acquisition date and monitor how their behavior changes over time, providing insights into long-term trends.
- Segmentation: Breaking down data by customer type, location, traffic source, or device type reveals nuanced patterns that can inform your strategy.
- Heat maps and waterfall charts: These tools highlight where users drop off, making it easier to identify and address problem areas.
- Trend analysis: Tracking seasonal patterns and measuring the impact of your optimizations over time can help fine-tune your approach. Automated reporting tools, such as those in GA4, can send regular updates on key metrics like conversion rates and revenue per visitor.
- Benchmark comparisons: Comparing your funnel performance over time or against industry standards provides valuable context. Even small improvements in key metrics can make a big difference to your bottom line.
Optimizing Funnels for Better Conversions
To improve conversion rates, it’s essential to let your funnel data guide your decisions. Data-driven adjustments can have a powerful impact on turning visitors into customers.
Using Behavioral Analytics for Targeted Improvements
Behavioral analytics tools help uncover the "why" behind user actions. They provide insights into how users interact with your site, making it easier to identify areas that need improvement.
For example, heat maps, session recordings, and user flow analyses show where users click, scroll, or drop off. If you notice users aren’t scrolling past a certain section on your product pages, it might be time to reorganize your content to better capture their attention. Similarly, session recordings can highlight friction points, and user flow analysis can reveal the most common paths users take. This helps ensure that high-converting pages are easy to find.
Tools like Amplitude allow you to dig even deeper by segmenting users based on specific behaviors. Let’s say you create a group of users who viewed a product multiple times but didn’t buy. By analyzing what sets them apart from those who did make a purchase, you might uncover opportunities for personalized email campaigns or tailored on-site experiences that encourage conversions.
Running A/B and Multivariate Testing
Testing is key to understanding what works - and what doesn’t - when it comes to boosting conversions. By comparing different versions of a page or element, you can pinpoint the changes that make the biggest impact.
A/B testing is a straightforward way to compare two variations, whether it’s tweaking your homepage hero section, adjusting your product layout, or refining your checkout process. Just make sure to run your tests long enough to gather meaningful data and account for natural traffic fluctuations.
For more complex pages, multivariate testing allows you to experiment with multiple elements at once. This method can reveal how various factors interact, but it usually requires a higher volume of traffic to achieve statistically valid results.
Documenting the results of every test is crucial. Even when a change doesn’t work, understanding why it failed can be just as valuable as discovering what succeeds. This knowledge will help you fine-tune your strategies and better connect with your audience.
Once you’ve used testing to validate changes, seeking expert guidance can take your optimization efforts to the next level.
Partnering with Clean Commit for CRO Expertise
While funnel data provides a strong foundation, translating those insights into significant conversion gains often requires specialized expertise. Many Shopify store owners excel at driving traffic but struggle to turn visitors into paying customers while juggling the demands of daily operations.
Clean Commit steps in to bridge this gap. They start with a detailed audit of your site to identify where potential customers are dropping off. From there, they craft a 90-day conversion roadmap tailored to your business needs.
By following a hypothesis-driven approach, Clean Commit ensures every change is backed by real data rather than relying on generic advice. They conduct A/B and multivariate tests to validate their strategies before implementing them fully, reducing risks while maximizing results.
For those hesitant to commit, Clean Commit offers a risk-free 30-day trial that includes up to three experiments. After the trial period, their service costs $6,000 per month, a fee that’s often offset by the increased revenue generated through their optimization efforts.
Conclusion
Funnel tracking in Shopify provides valuable insights into visitor behavior, highlighting where potential customers drop off during their journey. This process relies on integrating tools like Google Analytics 4, Amplitude, and Funnelytics to gather in-depth user behavior data.
By systematically analyzing this data, businesses can make smarter decisions. These tools help pinpoint user interactions and identify areas where improvements are needed. Through A/B testing, changes can be tested and refined, reducing risks while maximizing their impact.
That said, turning data into actionable strategies often requires specialized expertise. Many Shopify store owners find it challenging to bridge the gap between collecting data and effectively using it to drive results. Clean Commit addresses this challenge with a structured, data-driven approach, combining controlled testing and a detailed Shopify CRO audit. This method ensures measurable improvements in conversion rates.
For those hesitant about committing, Clean Commit offers a 30-day free trial that includes up to three experiments. This allows you to see tangible results before deciding on the $6,000 monthly service. Often, the additional revenue generated through their optimization efforts exceeds the service cost, making it a strategic move for long-term growth.
FAQs
How can I use funnel tracking to reduce cart abandonment on my Shopify store?
Funnel tracking is a powerful tool for identifying exactly where customers abandon their journey during the checkout process - whether it’s at the shipping details step or during payment. Once you know where the drop-off happens, you can simplify and improve those areas. For instance, make sure your shipping options are easy to understand and offer a variety of payment methods to suit different customer preferences.
It’s also essential to keep an eye on technical aspects like page load times. Slow-loading pages can frustrate customers and lead to abandoned carts, so addressing these issues promptly is key. To win back potential buyers, you might want to send follow-up emails or reminders shortly after a cart is left behind. These targeted adjustments can help reduce cart abandonment and increase conversions in your Shopify store.
What are the advantages of using tools like GA4, Amplitude, and Funnelytics together for tracking funnels on Shopify?
Using tools like GA4, Amplitude, and Funnelytics together can give you a clearer understanding of how users interact with your Shopify store. GA4 breaks down traffic sources and conversion paths, helping you see where your visitors are coming from and how they navigate your site. Funnelytics, on the other hand, lets you map out and visualize your funnel stages, making it easier to spot areas that might need tweaking. Then there’s Amplitude, which dives deep into user behavior across devices, showing you exactly where potential customers might be dropping off.
When you combine these tools, you’re not just collecting data - you’re turning it into actionable insights. This approach helps you refine your funnels, make smarter decisions, and ultimately increase your Shopify store’s conversion rates.
How does Shopify's Custom Pixel feature make tracking scripts more secure and efficient?
Shopify's Custom Pixel feature prioritizes security by restricting JavaScript-based code to a controlled sandbox environment. This setup ensures that harmful scripts can't run, keeping your store's data protected.
Beyond security, it offers precision in tracking specific customer actions. By collecting cleaner data with fewer mistakes, you can gain clearer insights into how your store is performing - all while maintaining a safe and reliable system.
