AFTCO tested a new design for product cards to boost user engagement and conversions. Discover the impact of simplifying their layout.
Enhanced Product Cards Drive User Engagement and Conversion Improvements
Goal
Conversion rate
Result
+0.6% Conversion rate
Category
Collection Page (PLP)
Outcome
Inconclusive
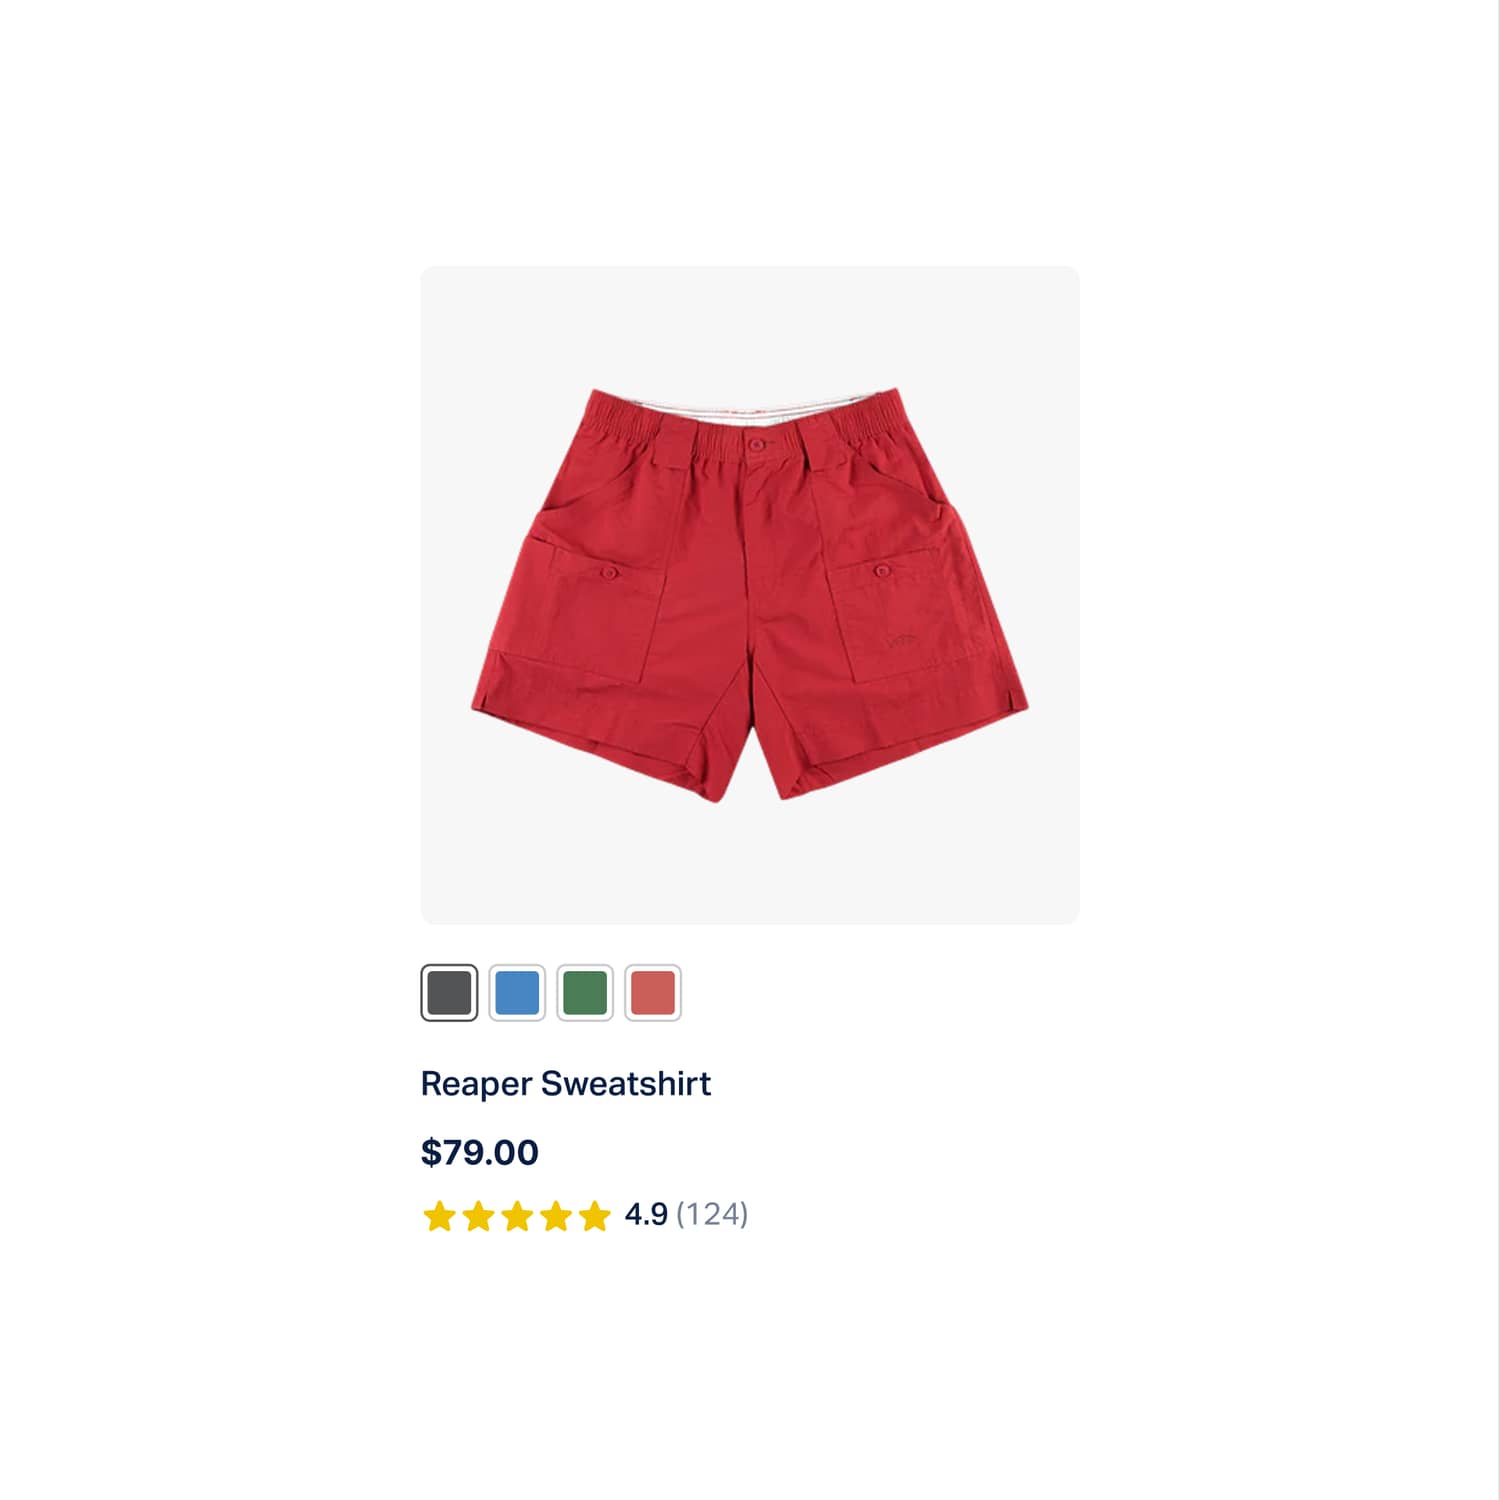
Before
After
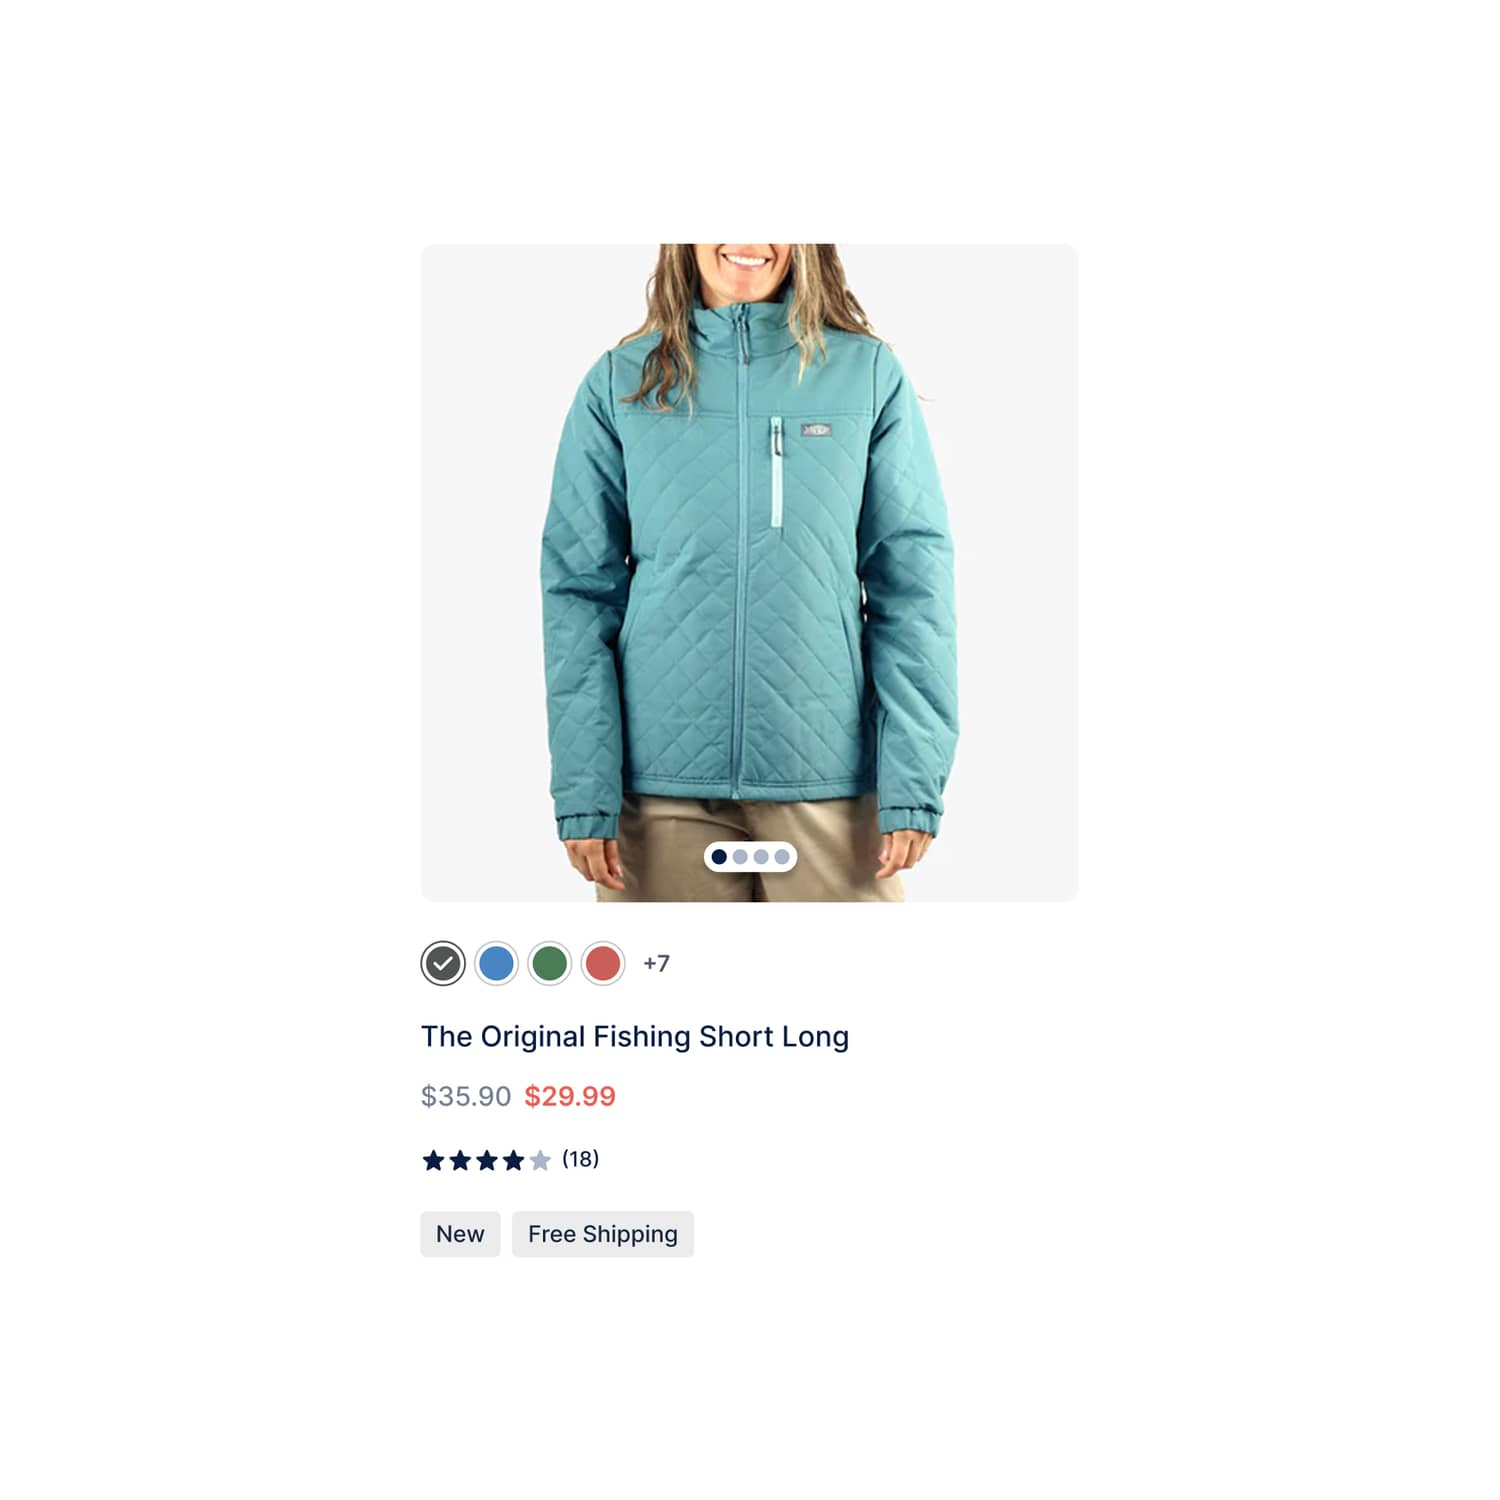
If we redesign AFTCO’s product cards by reducing visual clutter, optimizing space for pricing and charges, and allowing to swipe through the product colors, THEN we expect an increase in user engagement, higher conversion rates, and improved Average Order Value (AOV), BECAUSE a cleaner layout with larger product cards will enhance visibility, improve decision-making, and create a more seamless shopping experience.
What We Changed
- Reduced visual clutter on product cards.
- Made space for new badge designs.
- Added a scroll indicator for color options.
- Optimized space for pricing and charges.
The Results
We dig through every data source to map what's actually broken. By the end, there's no confusion.
+5.5%
Click-through rate change
+4.6%
Change in amount of clicks
+0.9%
Change in amount of orders
Key Learnings
- Simplified design improved mobile user engagement.
- Clearer pricing information aided decision-making.
- Single-column layout on mobile enhanced product focus.
- Despite the UI improvements, overall revenue dipped slightly suggesting customers were more comfortable with the original product cards and that the change may have disrupted familiar shopping behavior.
Detailed results breakdown
Add-to-cart rate change
-1.2%
Average order value
-1.9%
Click-through rate change
+5.5%
Lift in conversion rate
+0.6%
Change in revenue per visitor
-0.2%
Free Trial
Start with 3 experiments.
Zero cost.
Get a taste of our service. We'll analyze your store, pinpoint low-hanging fruit, design, implement and test solutions to lift your conversion rate in 30 days.
Who qualifies?
30,000+ Monthly sessions.
Minimum traffic needed to run statistically significant tests.
Running on Shopify or Shopify Plus.
Our specialty - we don't work with other platforms.
Investing in paid traffic.
We work with stores committed to growth, not hobbyists.
Ready to invest in systematic CRO.
You understand testing takes time - no magic bullets.
Why free?
The best proof is results. Three real experiments show you exactly how we work and whether it drives revenue for your specific store. You keep everything - no strings attached.
Our bet
We're confident enough in our process to invest our time upfront. If the tests work, you'll see the value in continuing at $5,950/month. If not, you got free optimization work.
Limited spots
We take only 4 free trials monthly to maintain quality. Each trial gets our full attention and expertise. If you qualify, secure your spot before this month fills up.
Other experiments we've run
Product Page (PDP)
Adding Free Shipping Message Boosts Conversion
Adding a free shipping message to the product page was tested to see if it boosts conversions. Discover how this simple change impacted customer behavior.
+3.68% (CVR) CVR

Product Page (PDP)
Redesigned Product Page Enhances Visuals and User Engagement
The product page was redesigned to improve visuals and engagement. Learn how these changes impacted conversion rates and user behavior.
-16.3% Conversion rate
Homepage
Enhanced Homepage "How It Works" Section
A new homepage section combining athlete's imagery and product explanations boosted mobile conversions. Discover the changes and results.
-3.5% Conversion rate