A simplified mobile layout increased average order value by 4.0% but led to higher bounce rates and lower conversion.
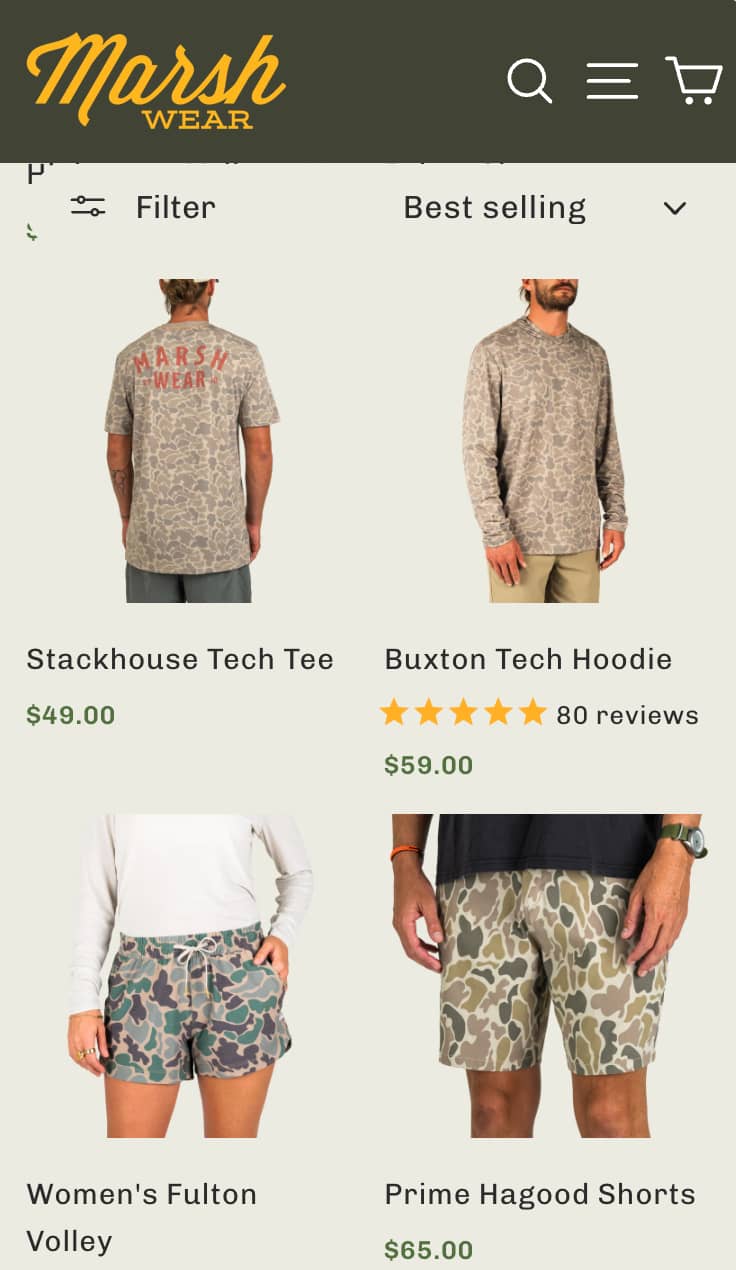
Simplified Mobile Layout
Goal
Conversion rate
Result
-4.2% Conversion rate
Category
Product Page (PDP)
Outcome
Loss Prevented
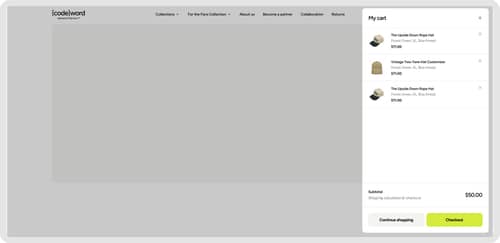
Before
After

IF we simplify the mobile layout by reducing visual elements and streamlining navigation, THEN average order value will increase BECAUSE users will focus on fewer, higher-value products with less distraction.
The mobile layout was simplified by removing secondary content blocks and reducing the number of visible elements on key pages. Navigation was condensed to prioritize the most popular product categories. The design was stripped back to focus user attention on primary product offerings rather than auxiliary content.
The Results
We dig through every data source to map what's actually broken. By the end, there's no confusion.
+14.3%
Bounce rate change
+4.0%
Average order value
-0.1%
visitors
While AOV gained +4.0%, conversion rate dropped -4.2% and bounce rate surged +14.3% — a clear signal that the simplified layout removed content users needed to stay engaged. CTR also fell -3.8%, suggesting users couldn't find what they were looking for. The marginal AOV improvement doesn't offset the significant engagement losses. Simplification went too far, removing useful navigation and content elements that helped mobile shoppers orient and convert.
Detailed results breakdown
Add-to-cart rate change
-0.4%
Average order value
+4.0%
Click-through rate change
-3.8%
Lift in conversion rate
-4.2%
Change in revenue per visitor
-0.4%
Free Trial
Start with 3 experiments.
Zero cost.
Get a taste of our service. We'll analyze your store, pinpoint low-hanging fruit, design, implement and test solutions to lift your conversion rate in 30 days.
Who qualifies?
30,000+ Monthly sessions.
Minimum traffic needed to run statistically significant tests.
Running on Shopify or Shopify Plus.
Our specialty - we don't work with other platforms.
Investing in paid traffic.
We work with stores committed to growth, not hobbyists.
Ready to invest in systematic CRO.
You understand testing takes time - no magic bullets.
Why free?
The best proof is results. Three real experiments show you exactly how we work and whether it drives revenue for your specific store. You keep everything - no strings attached.
Our bet
We're confident enough in our process to invest our time upfront. If the tests work, you'll see the value in continuing at $5,950/month. If not, you got free optimization work.
Limited spots
We take only 4 free trials monthly to maintain quality. Each trial gets our full attention and expertise. If you qualify, secure your spot before this month fills up.
Other experiments we've run

Collection Page (PLP)
Optimized Discount Price Styling
Discover how changing the styling of discounted prices impacted conversion rates and revenue for an e-commerce store.
+8.7% Conversion rate
Cart
Redesigned mini cart boosts user engagement and checkout conversions
Discover how implementing a mini cart improved user engagement and increased checkout conversions by optimizing the shopping experience.
+3.6% Conversion rate

Landing Page
Educational advertorial landing page boosts parent engagement and conversions
We tested an advertorial-style landing page to see if storytelling and educational content increase conversions from social traffic. Discover the impact of this approach on engagement and sales.
+2.3% Conversion rate