Simplifying the navigation bar produced modest positive trends across conversion rate, AOV, and RPV, but none reached statistical significance.
Simplified Navigation Bar
Goal
CVR
Result
+2.35% (CVR) CVR
Category
Search & Navigation
Outcome
Inconclusive
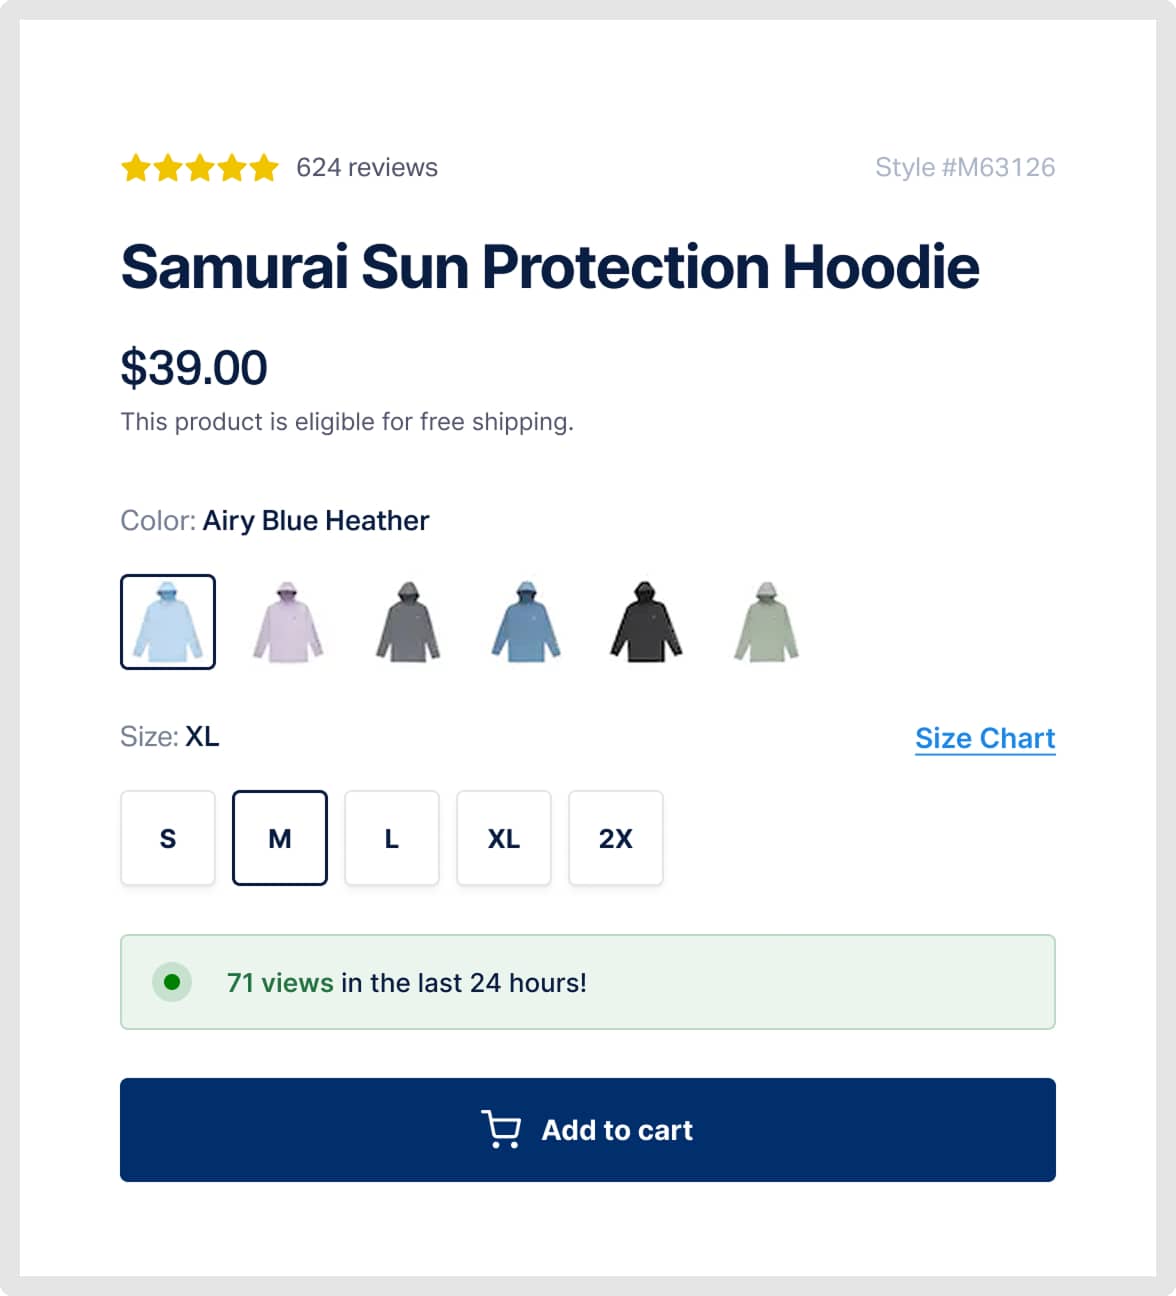
Before
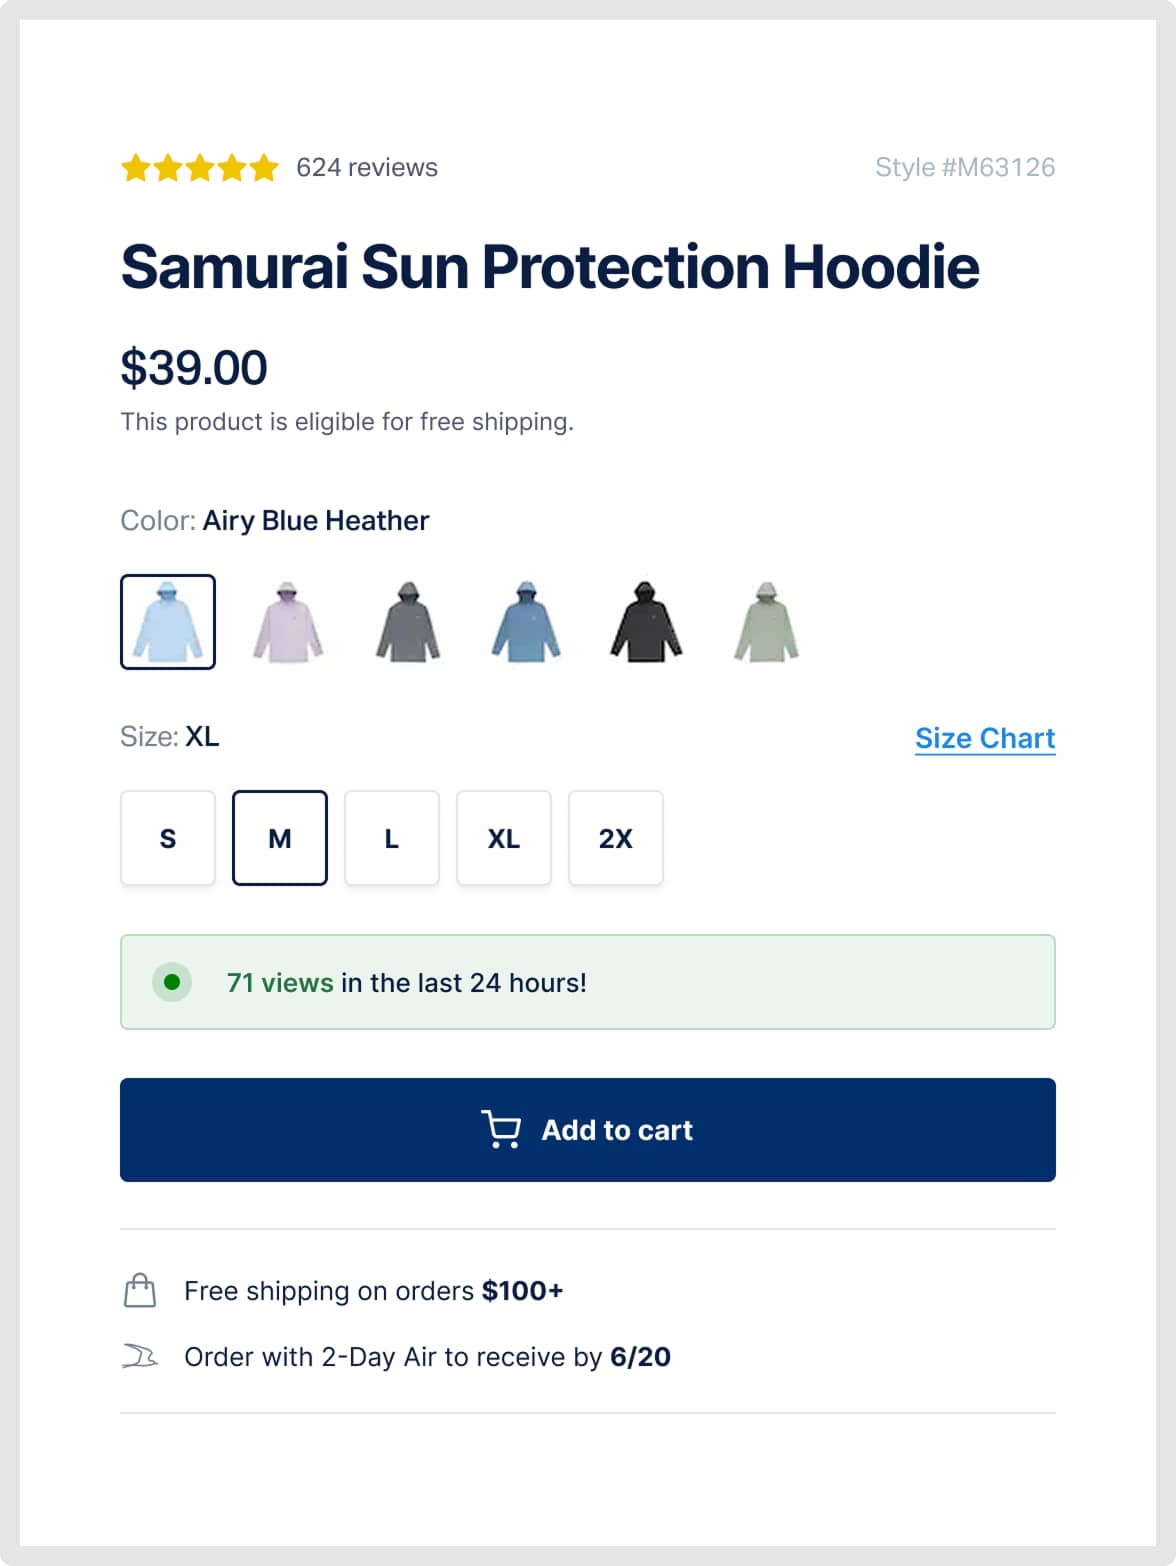
After
IF we simplify the navigation bar by reducing menu items and improving category organization, THEN conversion rates will increase BECAUSE users will find products faster with less navigational friction.
The navigation bar was simplified by consolidating menu items and improving the organization of product categories. The number of top-level navigation elements was reduced to minimize decision fatigue. Category labels were refined to be more descriptive and intuitive for users browsing the store.
The Results
We dig through every data source to map what's actually broken. By the end, there's no confusion.
+5.5%
Change in revenue per visitor
+3.0%
Average order value
+2.4%
Lift in conversion rate
All metrics moved in the right direction — CR +2.4%, AOV +3.0%, RPV +5.5%, and orders +1.6%. The RPV gain of +5.5% is the most encouraging signal, driven by the compounding effect of slightly better conversion and slightly higher basket sizes. However, with CR at only +2.4%, the result falls within the inconclusive range. The consistent positive trend across all metrics suggests this navigation simplification is directionally correct and worth iterating on with more aggressive changes to reach statistical significance.
Detailed results breakdown
Average order value
+3.0%
Lift in conversion rate
+2.4%
Change in revenue per visitor
+5.5%
Change in amount of orders
+1.6%
Revenue change
NaN%
Free Trial
Start with 3 experiments.
Zero cost.
Get a taste of our service. We'll analyze your store, pinpoint low-hanging fruit, design, implement and test solutions to lift your conversion rate in 30 days.
Who qualifies?
30,000+ Monthly sessions.
Minimum traffic needed to run statistically significant tests.
Running on Shopify or Shopify Plus.
Our specialty - we don't work with other platforms.
Investing in paid traffic.
We work with stores committed to growth, not hobbyists.
Ready to invest in systematic CRO.
You understand testing takes time - no magic bullets.
Why free?
The best proof is results. Three real experiments show you exactly how we work and whether it drives revenue for your specific store. You keep everything - no strings attached.
Our bet
We're confident enough in our process to invest our time upfront. If the tests work, you'll see the value in continuing at $5,950/month. If not, you got free optimization work.
Limited spots
We take only 4 free trials monthly to maintain quality. Each trial gets our full attention and expertise. If you qualify, secure your spot before this month fills up.
Other experiments we've run

Collection Page (PLP)
Redesigned square product cards boost mobile engagement despite mixed performance metrics
The redesign of AFTCO's product cards aimed to enhance user engagement and conversions by simplifying the layout and optimizing space. Discover the impact of these changes.
-5.64% (CVR) CVR
Product Page (PDP)
Product page redesign with updated fields boosts engagement and revenue
Changes to the product page led to increased engagement and higher revenue. Discover how these updates impacted key metrics.
+0.5% Conversion rate
Product Page (PDP)
Product Page AOV-Focused Redesign
A product page redesign focused on increasing average order value lifted AOV by 19.7% but decreased conversion rate by 9.9%.
+19.70% (AOV) AOV