Updating the category link design led to severe declines across all metrics, with conversion rate dropping 20.1% and RPV falling 26.3%.
Updated Category Link Design
Goal
CVR
Result
-20.08% (CVR) CVR
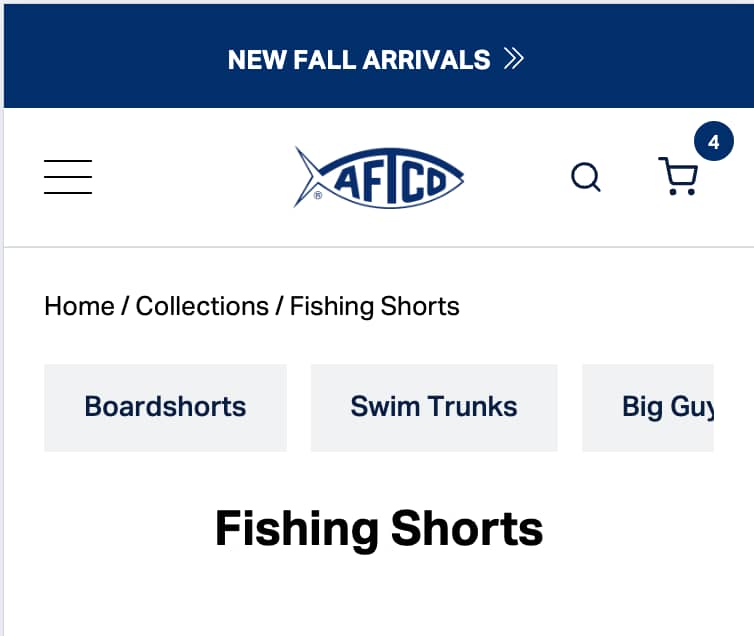
Category
Collection Page (PLP)
Outcome
Loss Prevented
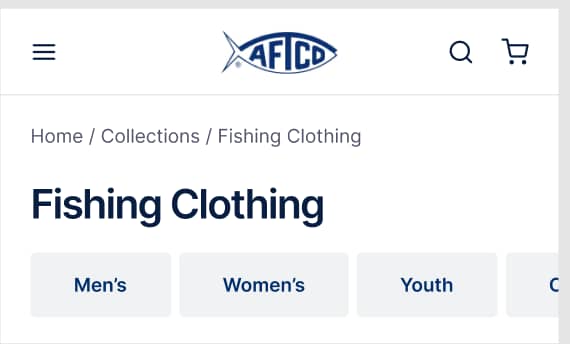
Before
After
IF we update the category link design to be more visually prominent and intuitive, THEN conversion rates will improve BECAUSE users will navigate to product categories more easily and discover relevant products faster.
The category link design was updated with new visual styling, sizing, and placement on the page. The links were redesigned to be more prominent with updated typography, color treatment, and hover states. The overall navigation pattern for accessing product categories was modified to test a different interaction model.
The Results
We dig through every data source to map what's actually broken. By the end, there's no confusion.
NaN%
Revenue change
-1.6%
visitors
-7.8%
Average order value
This was a significant loss across every metric — CR dropped -20.1%, orders fell -21.4%, AOV declined -7.8%, and RPV cratered -26.3%. The updated category link design clearly disrupted the established browsing pattern that users relied on to find products. The new interaction model created confusion and friction that cascaded through the entire funnel. This underscores how sensitive category navigation is to design changes — even well-intentioned visual updates can severely damage performance when they break familiar patterns.
Detailed results breakdown
Average order value
-7.8%
Lift in conversion rate
-20.1%
Change in revenue per visitor
-26.3%
Change in amount of orders
-21.4%
Revenue change
NaN%
Free Trial
Start with 3 experiments.
Zero cost.
Get a taste of our service. We'll analyze your store, pinpoint low-hanging fruit, design, implement and test solutions to lift your conversion rate in 30 days.
Who qualifies?
30,000+ Monthly sessions.
Minimum traffic needed to run statistically significant tests.
Running on Shopify or Shopify Plus.
Our specialty - we don't work with other platforms.
Investing in paid traffic.
We work with stores committed to growth, not hobbyists.
Ready to invest in systematic CRO.
You understand testing takes time - no magic bullets.
Why free?
The best proof is results. Three real experiments show you exactly how we work and whether it drives revenue for your specific store. You keep everything - no strings attached.
Our bet
We're confident enough in our process to invest our time upfront. If the tests work, you'll see the value in continuing at $5,950/month. If not, you got free optimization work.
Limited spots
We take only 4 free trials monthly to maintain quality. Each trial gets our full attention and expertise. If you qualify, secure your spot before this month fills up.
Other experiments we've run
Other
Wishlist feature
Enabling a wishlist feature increased return visits and conversions by simplifying the path to purchase. Discover how this change impacted key metrics.
+4.2% Conversion rate

Homepage
Directing Ads Traffic to the Homepage Boosts Conversions and Revenue
The test redirected traffic from Hockey ads to either the homepage or the optimized Hockey Landing Page to evaluate the impact on conversion and engagement.
+83.5% Add-to-cart rate
Cart
Simplified Checkout Process
Simplifying the checkout lifted AOV by 9.9% and RPV by 8.9%, but conversion rate was flat at -1.0%.
-0.97% (CVR) CVR