 Talk to a human
Do Product Reviews Increase Conversion Rate? (2026 Data)

I've worked with a massage table manufacturer for about two years now.
Their tables run from $1,500 up to around $5,000. When I came on, they had zero reviews. Not a handful. None at all.
They'd brought me in about their conversion rate, and reviews were one of the first things I raised.
I think they knew reviews mattered in the way everyone knows reviews matter, sort of anecdotally, without anyone having ever done the maths on it.
So I explained it. It seemed to land.
Then nothing happened for a good while, because it sat on a list behind things that felt more urgent.
The bit that bugged me was that I didn't have a number I could actually stand behind. I had the same stats everyone has, the ones on every CRO blog and on the marketing page of every review app.
So I went and dug through the research properly, trying to find something I'd be comfortable putting in front of a client.
Pretty much all of it fell over.
There's a real answer underneath the rubbish though, and I reckon it's more useful than the made-up version. So this covers what holds up, where reviews should sit on the page and what to do if you're starting from nothing.
The 270% number everyone quotes is junk
If you're ever searched for an answer about the efficacy of reviews, you've probably seen this 270% number. "Displaying reviews increases conversion by 270%."
It comes from the Spiegel Research Center at Northwestern and it gets cited everywhere. Agency decks, app store listings, pitch documents. It's the load-bearing stat for the entire reviews industry.
I went and read the original (not the most engaging content... but someone has to do it).
The actual claim is that purchase likelihood for a product with five reviews is 270% greater than for a product with no reviews. So it's five versus zero, and it's purchase likelihood rather than a measured conversion lift.
Already a fair way from how it gets repeated.
Then it gets worse. The data came from PowerReviews, who sell review software, and there's no published methods section, no sample breakdown, no controls listed.
The whole thing is correlational too, which matters more than it sounds.
Products that have reviews are products that have already sold. Popular products pick up reviews, and popular products convert better.
Oh, and the study was first announced in August 2015... and things have changed a bit since then.
- 270% Claimed lift
- 2015 vendor study
- Correlational 40%.
Same analysis re-run on independent clickstream data: - 5-9% Revenue lift per star
- Causally identified
The middle number is worth explaining.
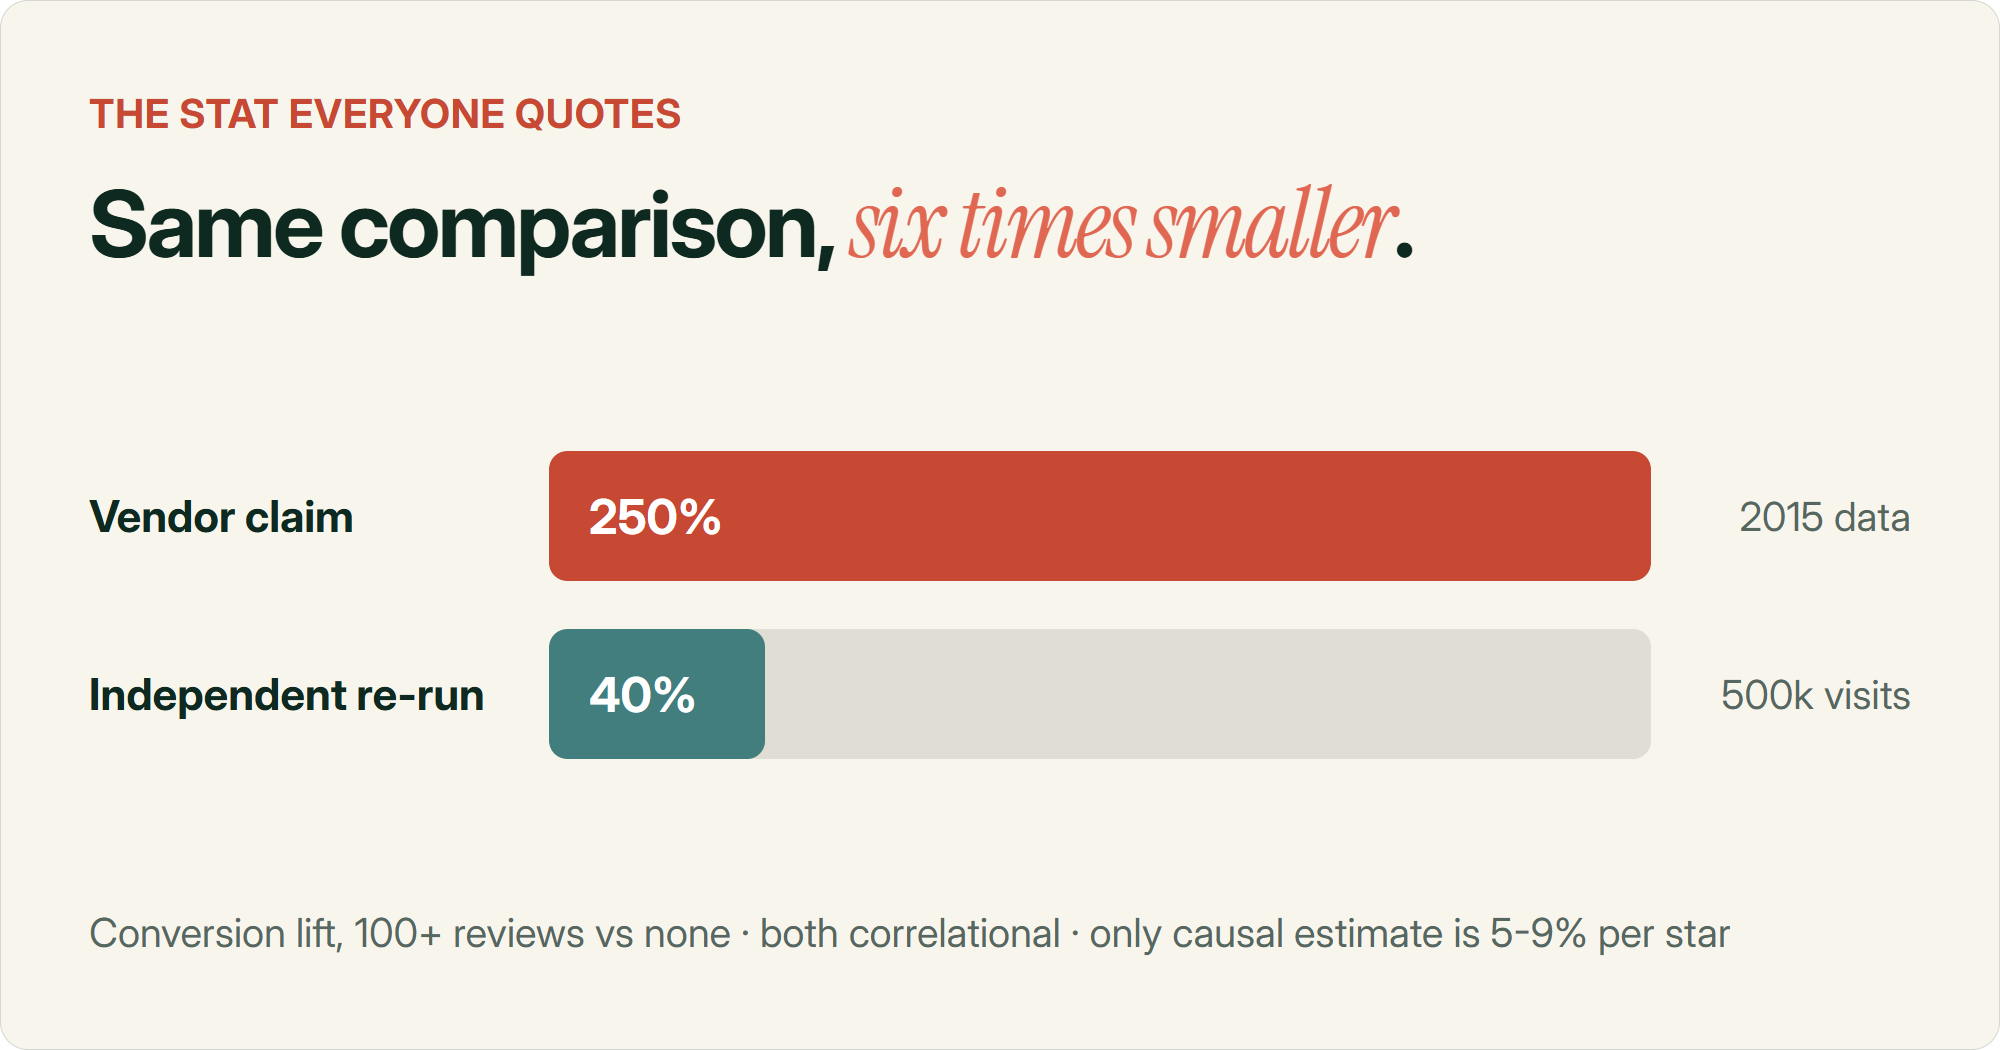
PowerReviews also publish a figure that products with 100+ reviews convert 250% better than products with none. StackTome ran the same comparison on their own clickstream data and got 40%.
About a sixth of the industry number, and to their credit they then said outright you'd need an A/B test to claim causation at all.
Why almost every review stat is inflated
There's one problem sitting underneath most of these numbers. The typical vendor calculation goes like this:
Take everyone who clicked into the reviews on a product page, take everyone who didn't, compare the conversion rates.
That comparison is mostly measuring intent.
People who scroll down and open the review section are already much further along in deciding to buy. They were going to convert at a higher rate whether or not the reviews existed.
So you get these enormous numbers like 137%, 144% and 161%. They tell you almost nothing about what happens if you add a review widget to a page.
It's the reason vendor stats come out roughly an order of magnitude bigger than the academic ones.
Again, I'm not saying the vendors are lying. The numbers are mostly likely real and accurately gathered. They're just answering a different question than the one you're asking.
What actually holds up
Right, so what survives?
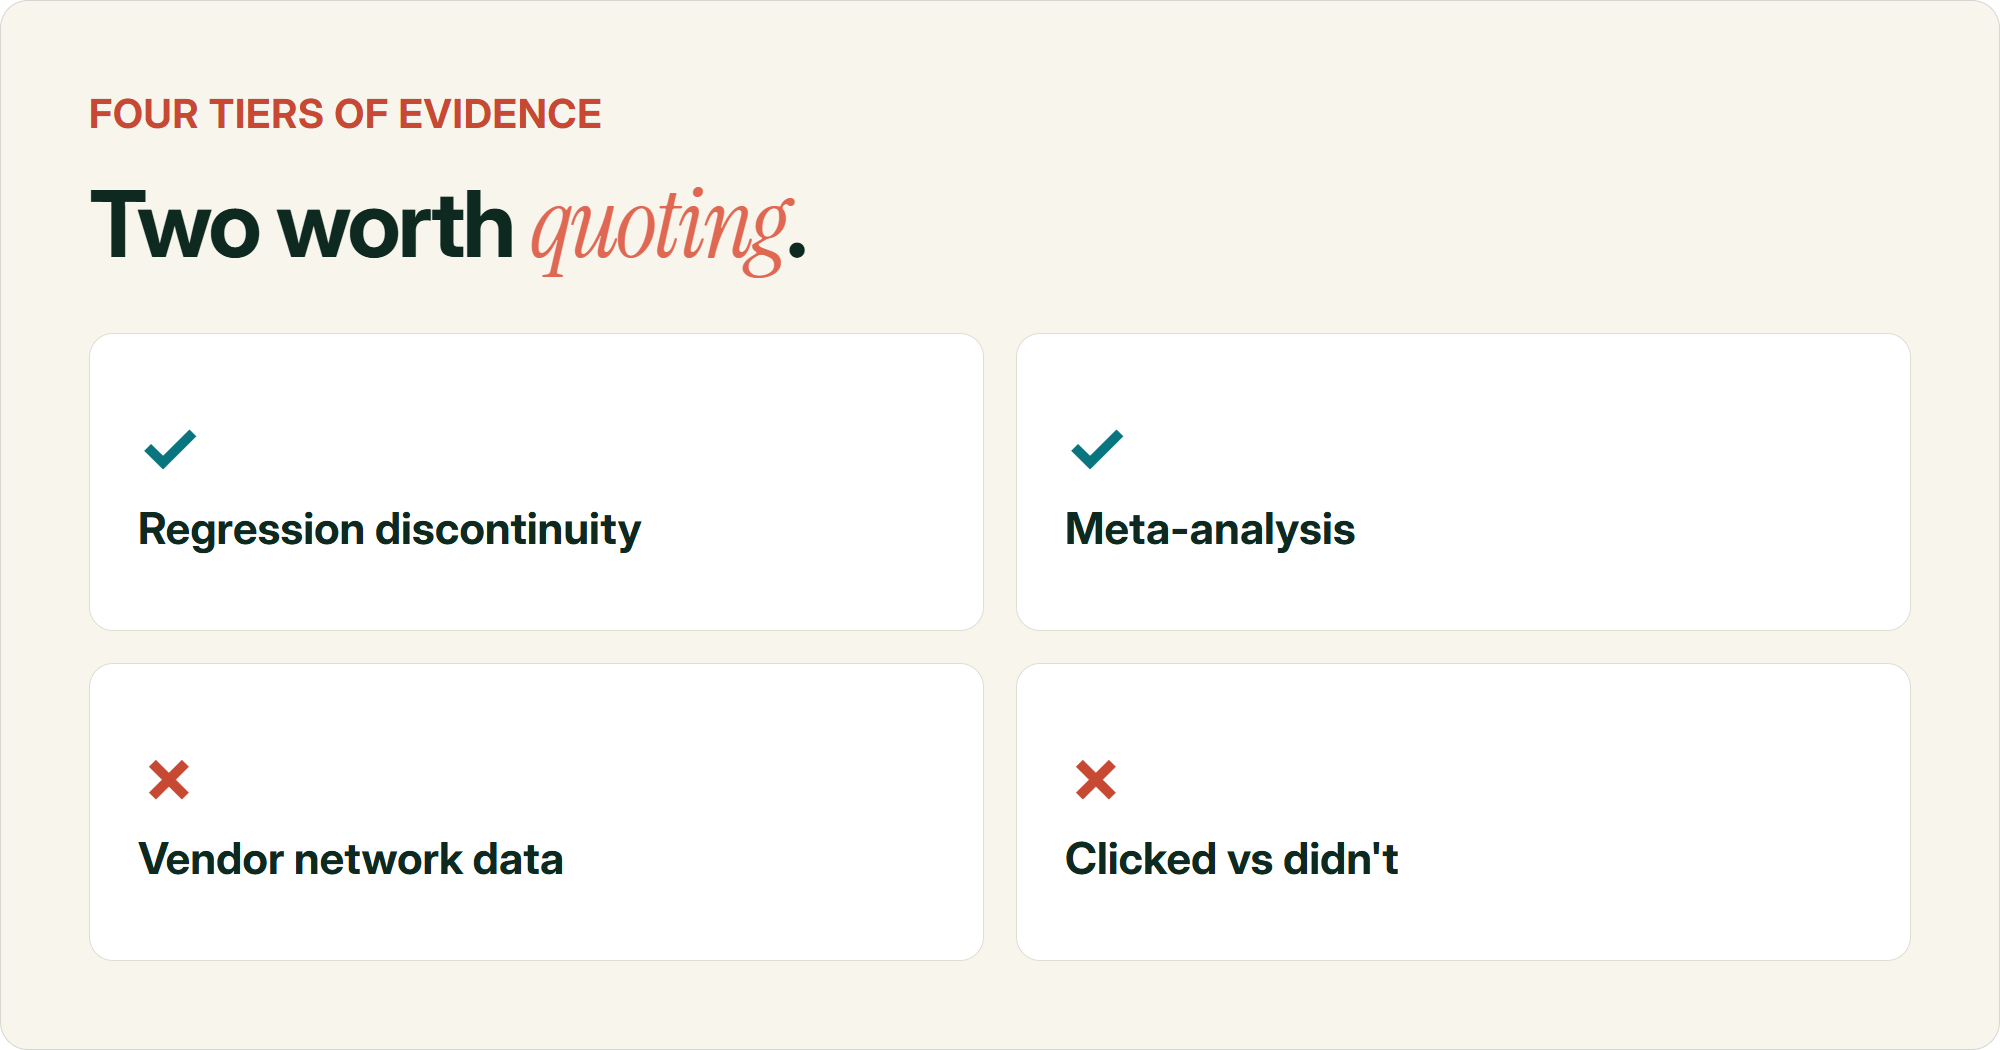
The strongest evidence comes from two studies on Yelp, and they work because of a quirk in how ratings get displayed.
Yelp rounds to the nearest half star. A business sitting at 3.24 shows as 3.0, and a business at 3.26 shows as 3.5.
Those two are basically identical in quality, and which side of the line you land on is effectively random. So you can isolate the effect of the rating itself.
Michael Luca at Harvard matched Yelp ratings against audited restaurant revenue data from the Washington State Department of Revenue. A one-star increase in rating causes a 5 to 9% increase in revenue.
A separate study using the same rounding trick found an extra half star made restaurants sell out 19 percentage points more often at peak times.
That's a genuine causal number and it's a very long way from 270%.
Two more things from the academic side that are actually useful.
The largest meta-analysis covers 96 studies and finds reviews correlate with sales at r = .091. Real, positive and modest. The marketing implies something a lot bigger.
And the rating does about twice as much work as the review count. Across 51 studies, valence elasticity came out at .417 against volume elasticity of .236.
Which means the star average earns its spot on the page before the wall of review text does.
The finding I'd pay most attention to
In the Yelp data, the revenue effect showed up entirely for independent restaurants. Chain restaurants got nothing. Reviews do their heaviest lifting when the buyer doesn't already know who you are, which is exactly the situation most Shopify brands are in.
Zero reviews on a $3,000 massage table
Back to the table manufacturer.
They're an unknown brand selling a considered purchase at a high price point to buyers who are going to research it properly.
Every part of that stacks up badly when the product page has nothing on it.
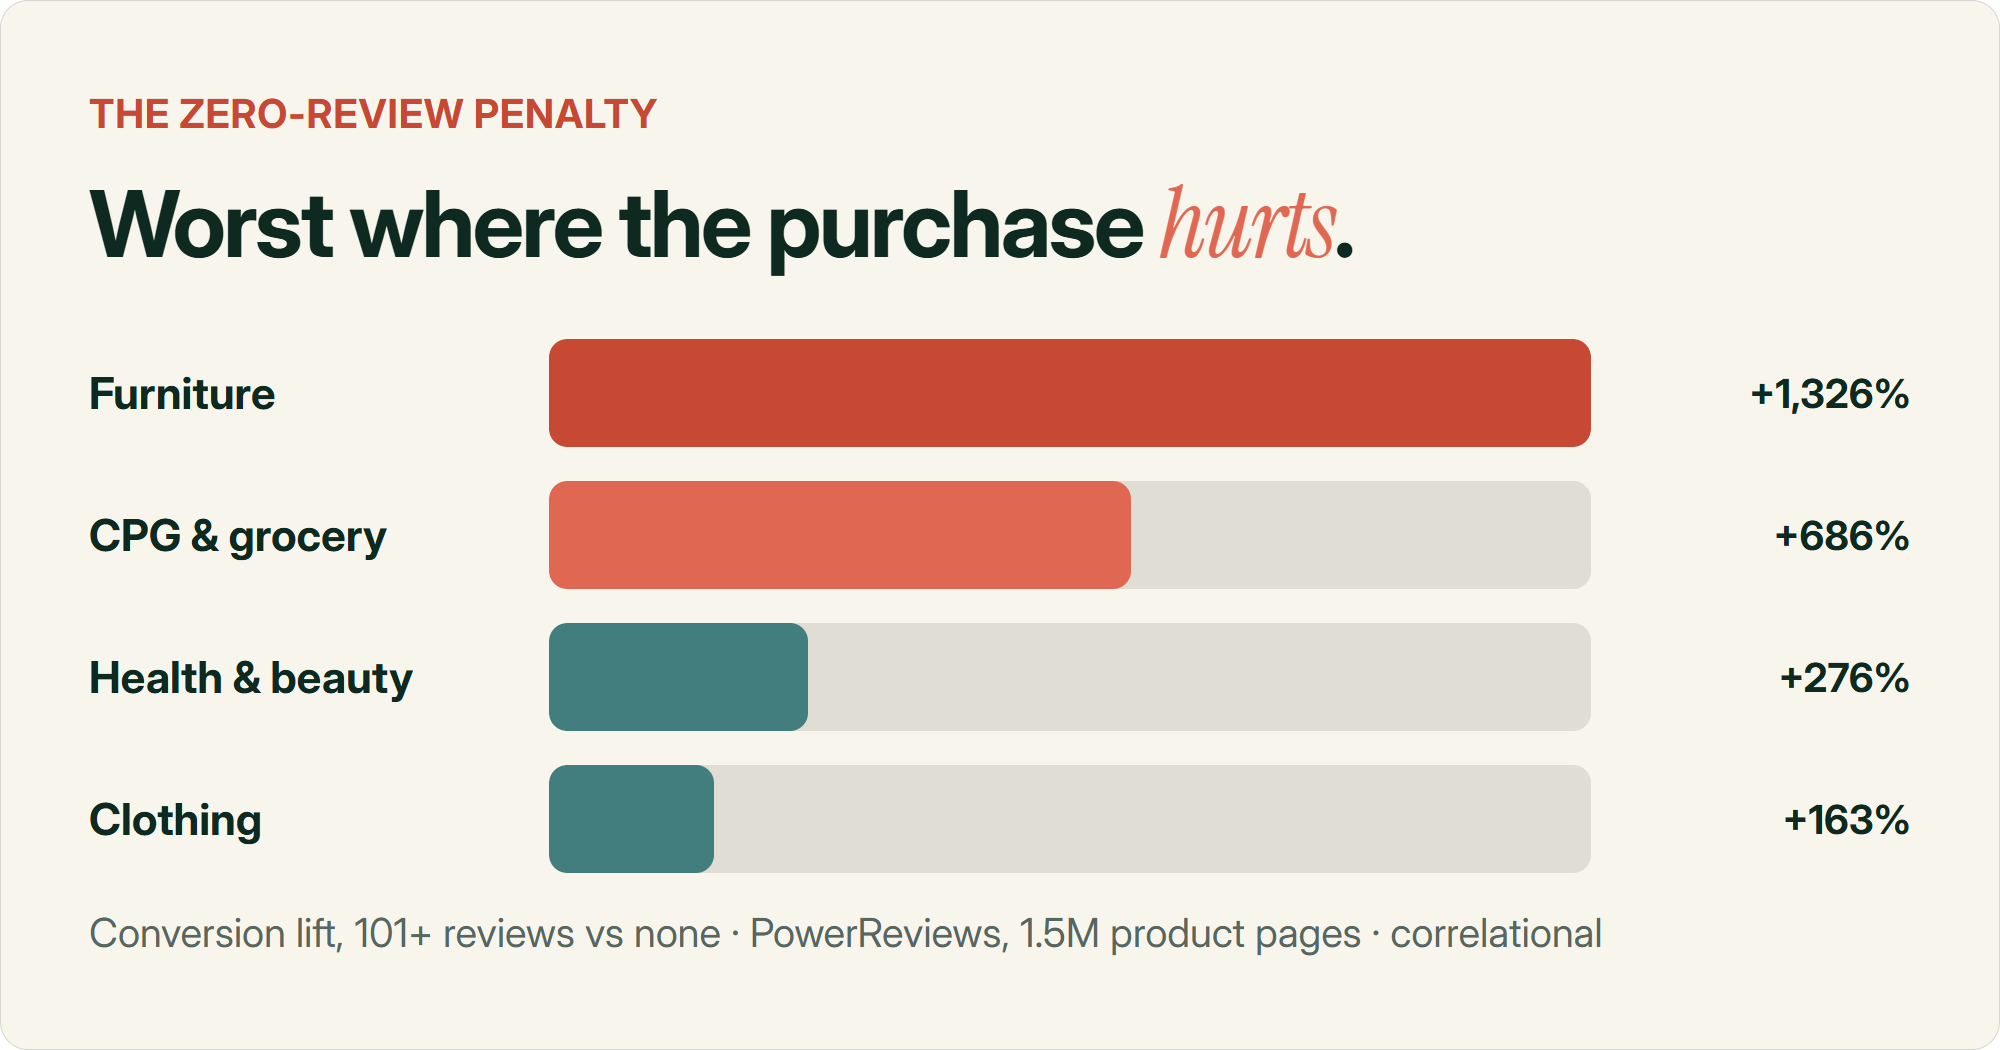
The zero-review penalty isn't spread evenly across categories. PowerReviews' data has furniture products with 101+ reviews converting over 1,300% better than furniture with none, while health and beauty at 1 to 10 reviews only shows +22%.
That furniture number is obviously confounded (bestsellers accumulate reviews, and that's most of what's being measured) but the pattern across categories is consistent and it makes sense to me.
The more a purchase costs and the more it feels like a commitment, the more the buyer wants to see that someone else did it first.
A $3,000 massage table is about as considered as ecommerce gets.
For volume, the honest version is roughly this. One review beats zero by a measurable amount, and five to ten gets you past the "is this thing real" threshold.
Around a third of shoppers say a product needs more than 100 reviews before they'll call it credible, so hero products justify a bigger push.
Then you have to keep going, because reviews go stale faster than people expect.
38% of shoppers say they won't buy if all the reviews are three or more months old. At twelve months it's 62%.
So review collection is an ongoing thing rather than a project you finish.
The other version of this problem I see a lot is brands that go all-in on Trustpilot and never install a per-product review widget.
They end up with a solid brand-level rating, a badge in the footer and product pages that still can't answer the only question the buyer actually has, which is whether this specific product is any good.
Brand trust and product trust are separate jobs. Trustpilot does one of them.
Reviews sit at the bottom of the page because that's where the widget put them
Almost every Shopify store I've worked on has the review block at the bottom of the product page.
Below the description, below the shipping accordion, below the FAQ, below whatever else the theme piled up down there.
Nobody decided that. It's just where the widget lands when you install it.
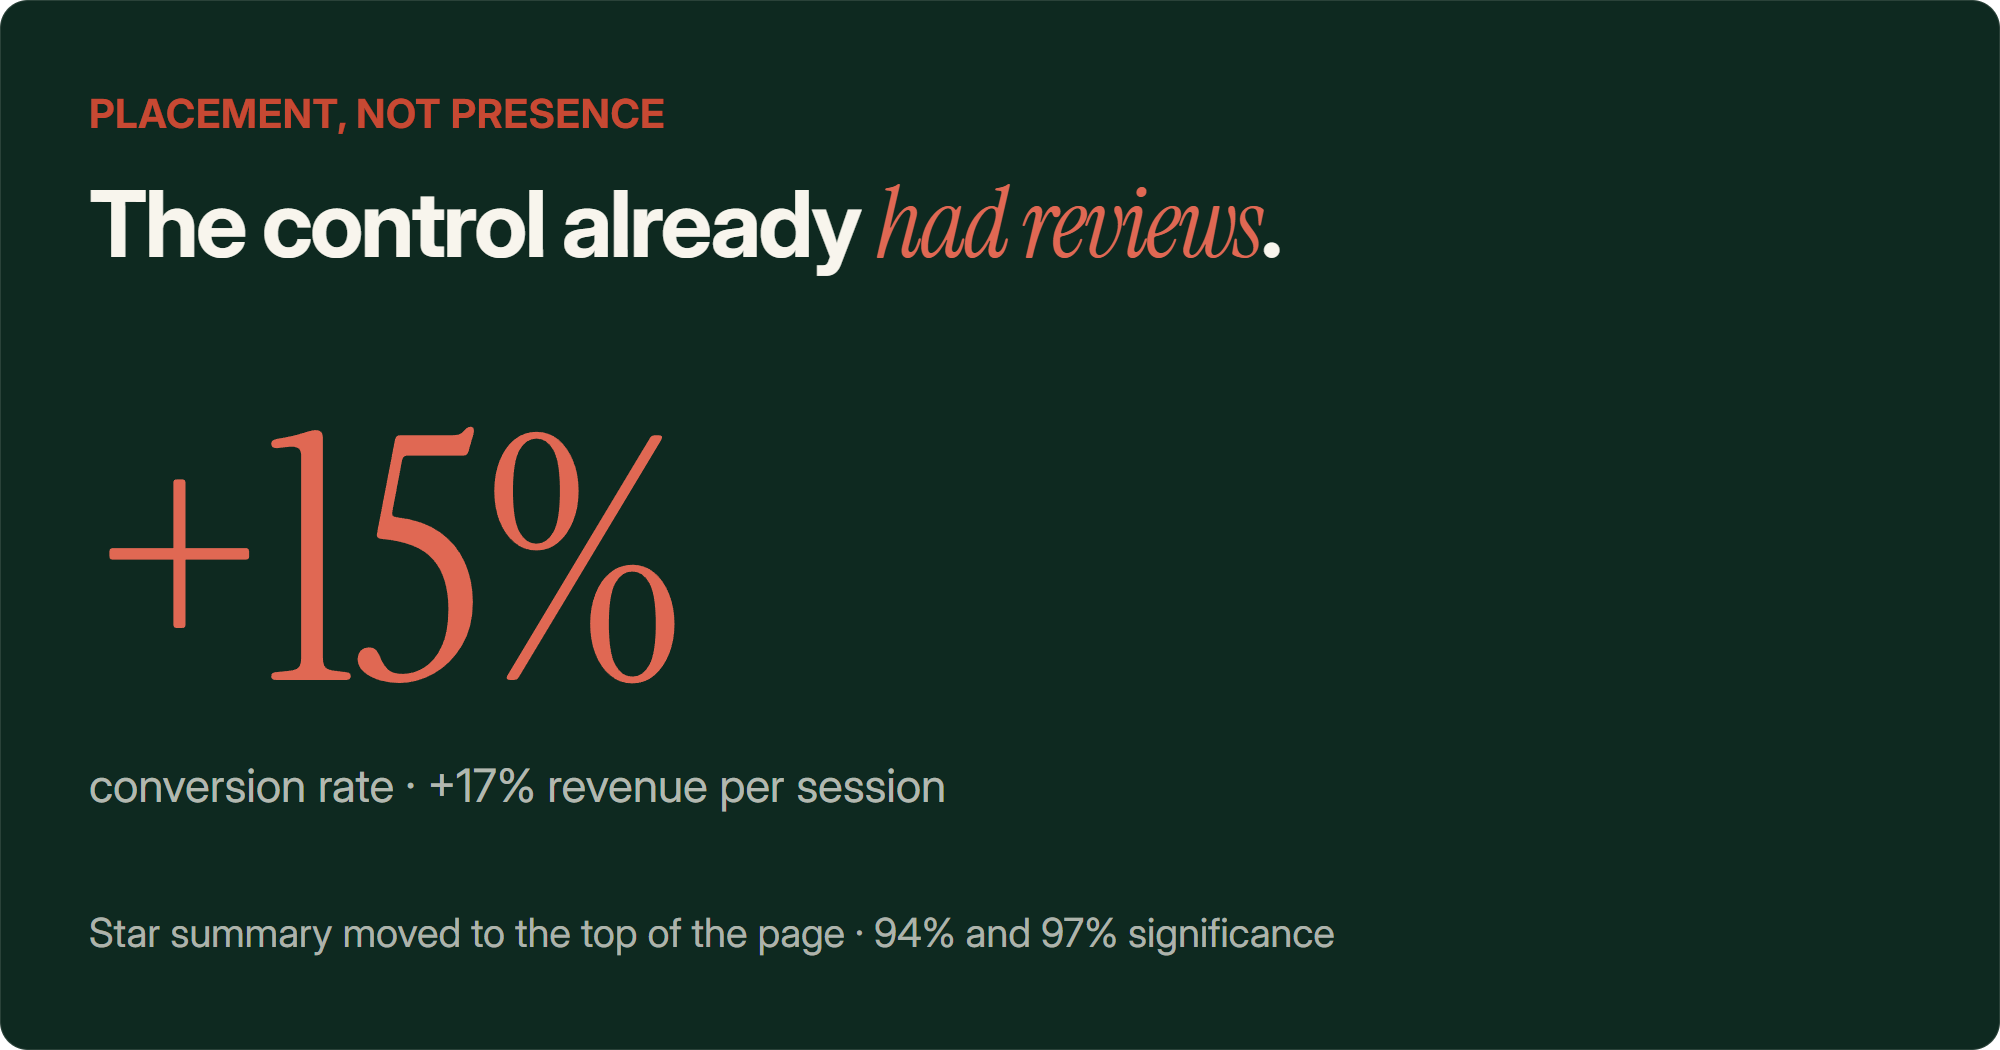
The best test I could find had a control that already had reviews at the bottom of the product page. The variant added a star rating summary near the top.
Conversion rate went up 15% at 94% significance, revenue per session up 17% at 97%.
Worth caveating properly, given I've spent two sections complaining about weak stats. Sample size and duration weren't published, and 94% sits under the usual 95% bar.
It's one test, one client, in apparel. I wouldn't promise anyone 15%.
But it's the cleanest placement test I could find anywhere, because the control wasn't missing its reviews. It had them.
The only thing that changed was making them visible earlier.
+15% conversion lift from adding a star summary to the top of a page that already had reviews at the bottom
The odd part of that result is that add to cart didn't move at all. Only conversion and revenue.
The agency's read was that shoppers use add to cart as a bookmark on considered purchases, wander off and come back later when they're actually deciding. So the star summary does its work on the return visit rather than the first one.
I don't know if that's right. It could just as easily be a statistical artefact, and with no sample size published you can't tell either way.
But it matches how people describe buying a $3,000 table, and it has an annoying implication for testing. If reviews mostly influence returning visitors, a two week test measuring first-session add to cart is going to under-detect the effect.
Worth thinking about when you're picking which tests to run.
We've moved review content up the page on a few stores now and it's been consistent in the same direction. More people see them, which is sort of the whole point.
Tabs are where reviews go to die
This is the strongest finding in the placement research and it's not close.
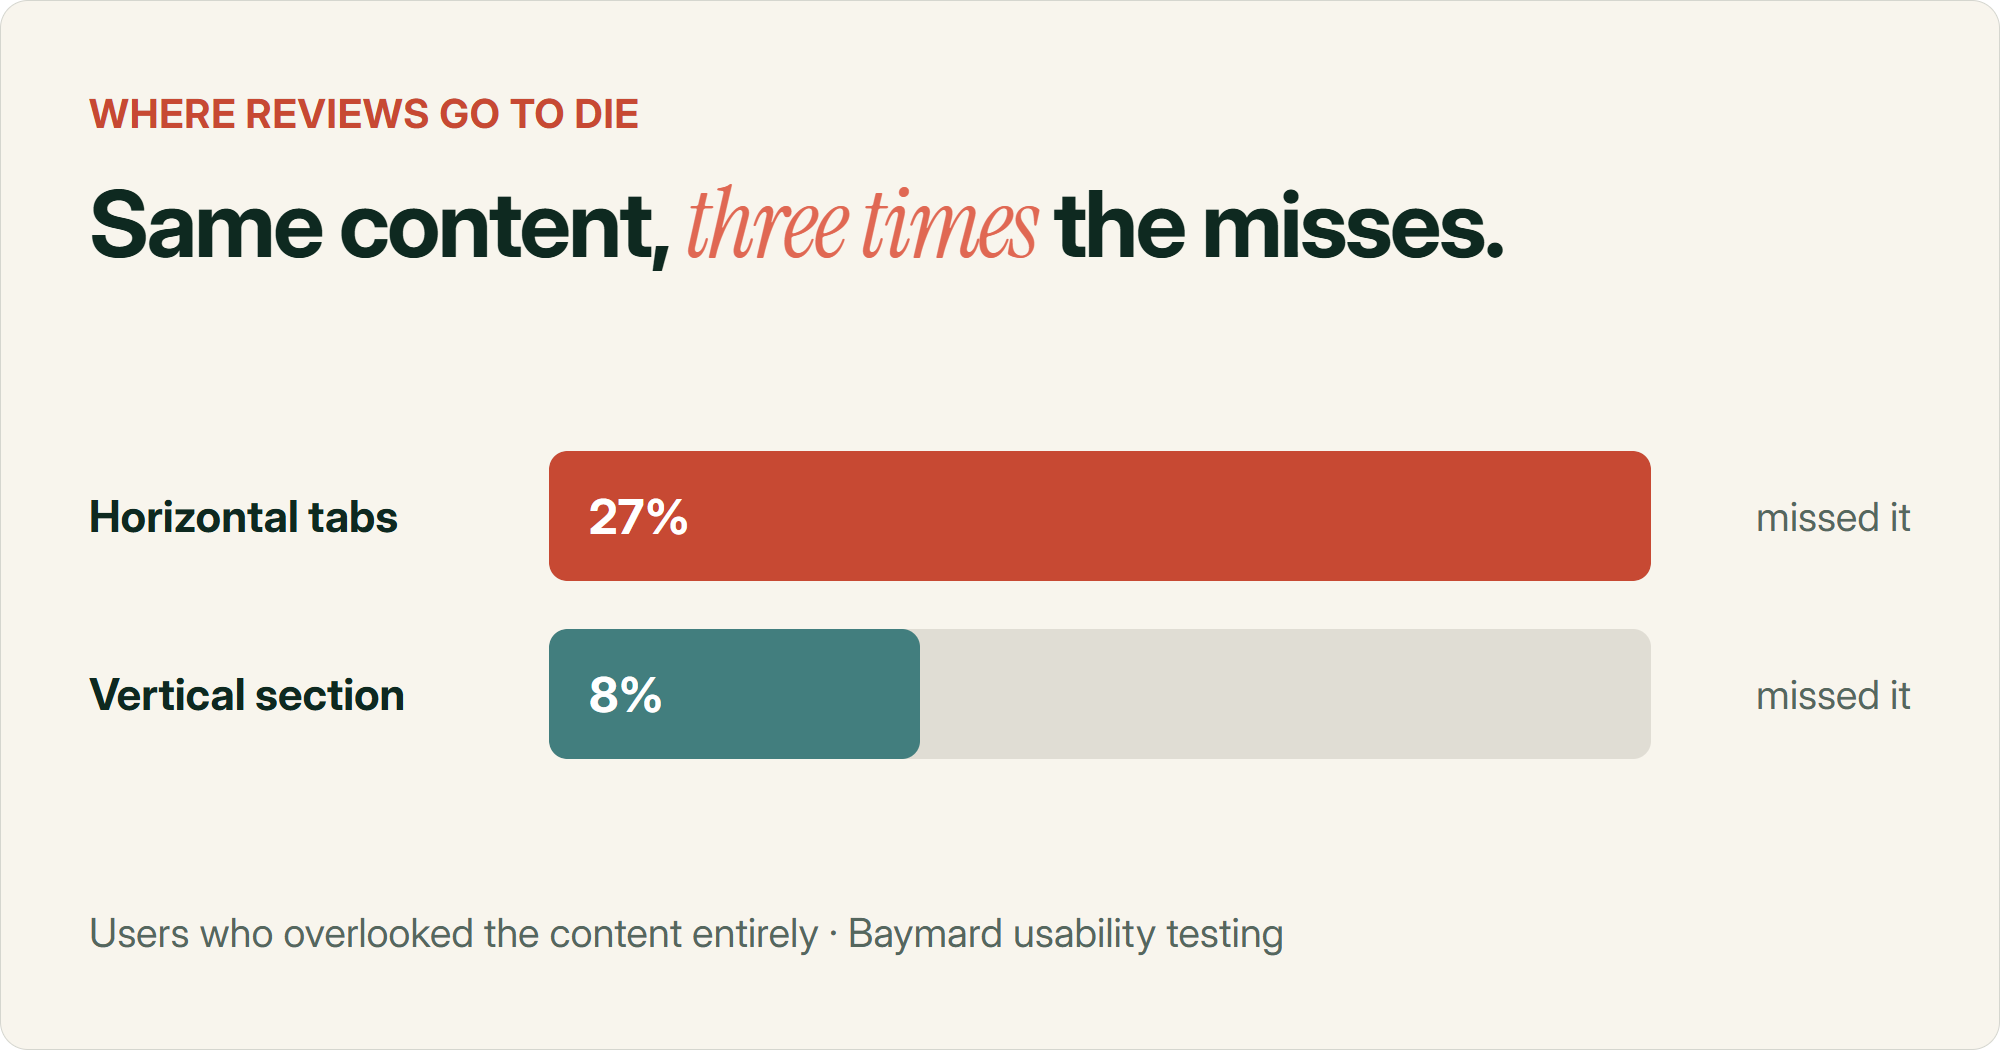
Baymard's usability testing found 27% of users completely overlooked content sitting behind horizontal tabs. For the same content in a vertically stacked section, it was 8%.
More than three times the miss rate.
And "Product Reviews" was one of the specific tabs they watched people fail to find, while those people were actively hunting for reviews. One participant said "I totally missed this little tab thing here."
29% of the big ecommerce sites Baymard benchmarks still do it.
27% of users miss content behind horizontal tabs8% miss the same content in a vertical section
Mobile has its own version of this and it's worse.
26% of sites push product page content to a subpage on mobile, which Baymard classes as a severe issue because users simply never go there. A lot of review apps default to a "See all reviews" link that opens as a full screen takeover, which is the same problem wearing a different hat.
Their other point is one I hadn't considered. Mixing patterns is worse than picking a bad one.
If your description is an inline accordion and your reviews are on a subpage, people can't build a mental model of the page. Pick one pattern and use it for every block.
Go and check your own product page
Open a product page on your phone. Count how many taps it takes to read a review. If the answer is more than zero, that's your first test. Then check whether the star rating and review count appear anywhere above the fold.
The collection page nobody uses
If reviews only exist on your product pages, you're making people click into a product to find out whether it's worth clicking into.
Baymard ran five separate surveys on this with over 5,170 respondents. They showed people two products with identical price and description, varying only the rating and the number of ratings.
Nearly twice as many people picked the product rated 4.5 stars from 57 reviews over the one rated 5 stars from 4 reviews.
So show the count, not just the stars.
Bare stars with no number is the Shopify default and it throws away the more useful half of the signal.
One caveat I'd take seriously though.
There's a documented test where removing star ratings from category pages actually improved add to cart. The reasoning was that every product in the collection sat at roughly the same rating, so the stars carried no real information and just added noise.
That makes sense to me. Stars on a collection page only help if they vary.
Check the spread across your catalogue before assuming it's a win.
GoodUI has aggregated seven tests on customer star ratings across 1.1 million visitors, and the placements those tests hit are listing pages, homepages, signup funnels and checkout reassurance. Barely any of them are the bottom of a product page.
The people running the most rigorous tests in this space have already stopped treating reviews as a product page feature.
Curating your way to a 5.0 works against you
I've seen brands filter their reviews to push the average up toward 5.0, and I understand the instinct. Higher number, more sales. Feels obvious.
The research goes the other way, though it's messier than the version that usually gets repeated.
You'll see "4.2 to 4.7 is the ideal star rating" quoted a lot. That comes from the same 2015 Spiegel study as the 270% figure, it's never been replicated and Spiegel's own website states it as 4.2 to 4.5 on one page and 4.2 to 4.7 on another.
I wouldn't quote a precise band to a client.
The underlying idea holds up much better than the specific numbers do, and the evidence for it is independent.
A 2022 paper in Marketing Science looked at ratings across five online marketplaces and found average ratings have drifted upward over time without customer satisfaction improving to match.
They call it reputation inflation.
People leave generous ratings because they don't want to hurt the seller, and since the ability to hurt the seller is the only thing that made a rating informative in the first place, the signal degrades. Their line is that reputation systems "sow the seeds of their own irrelevance."
Which is a long way of saying a 5.0 doesn't mean what it used to.
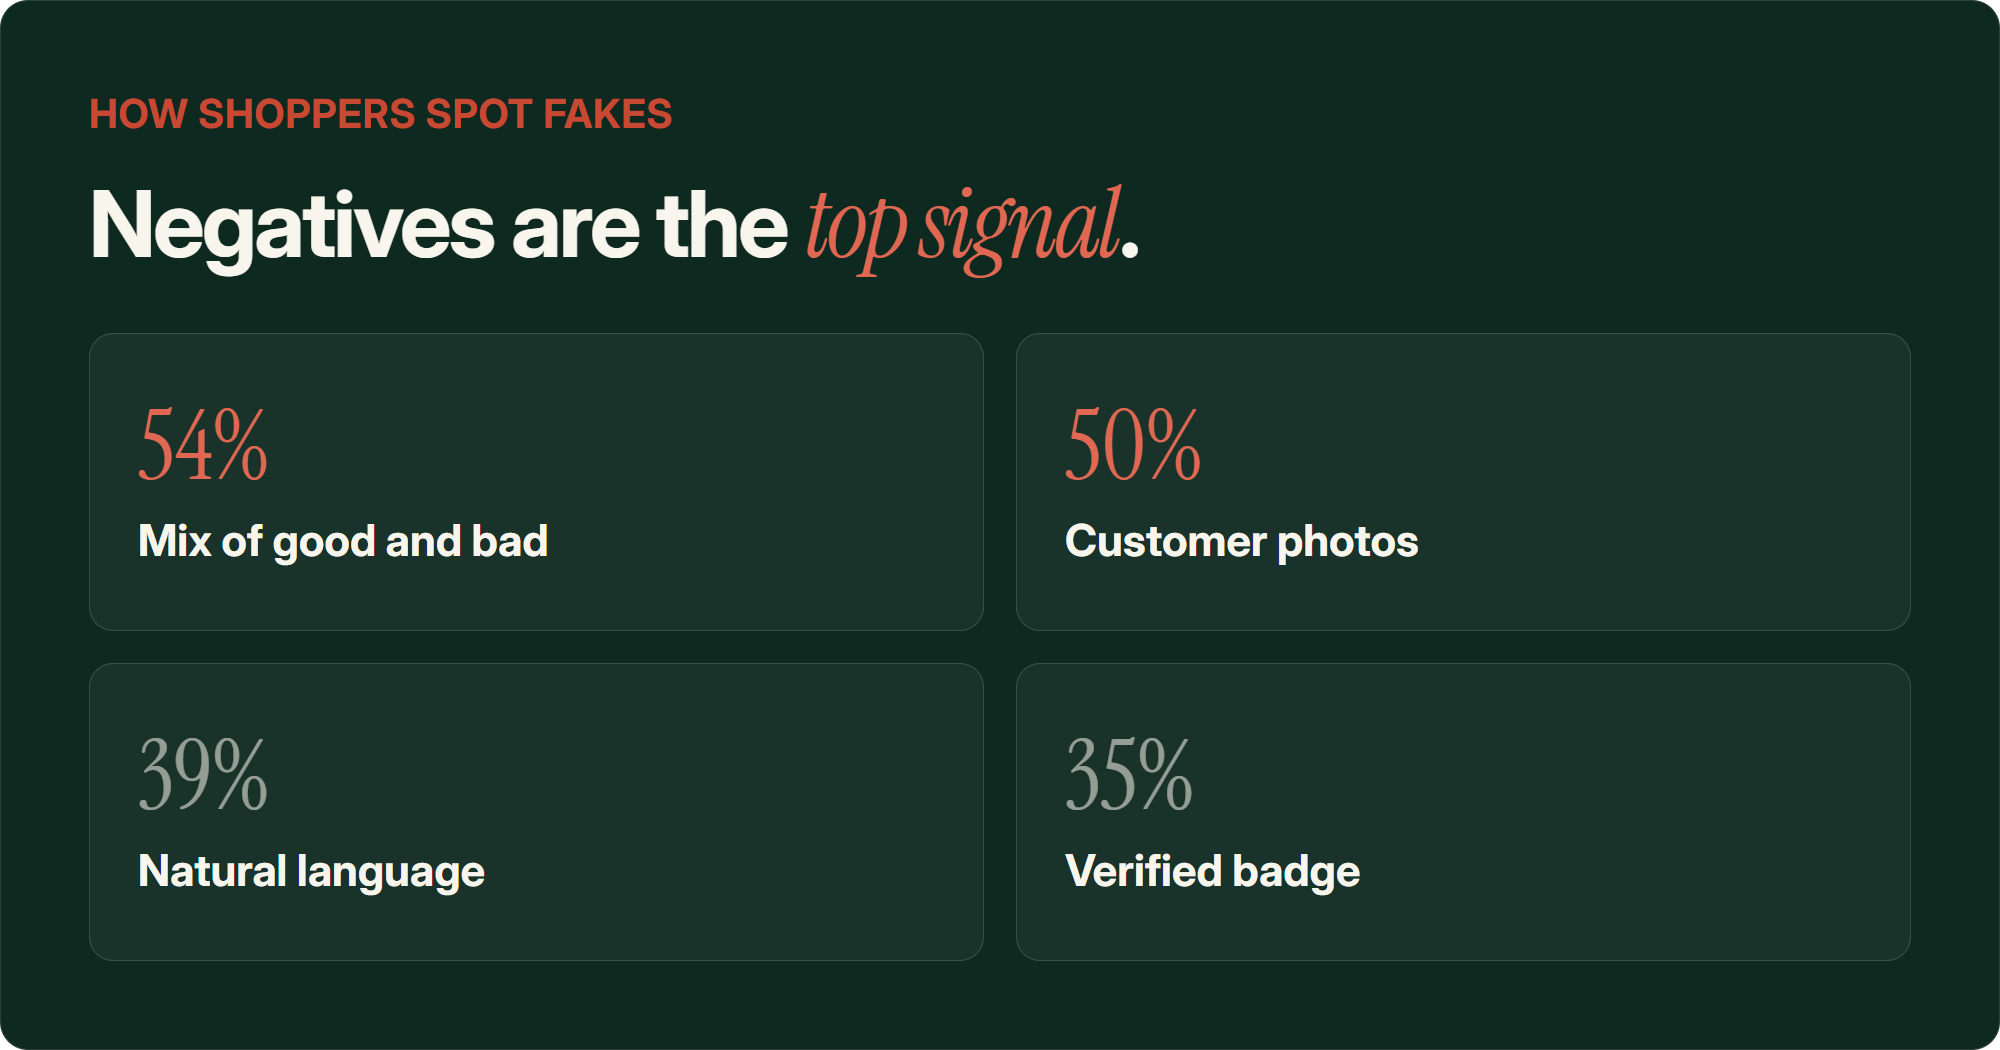
Shoppers have adjusted. When Bizrate asked 1,006 US shoppers in November 2025 what signals they use to judge whether reviews are legitimate, the top answer was a mix of positive and negative reviews.
Ahead of photos. Ahead of verified purchase badges.
44% of the youngest shopper group say they'd distrust reviews entirely if there were no negative ones. A spotless page reads as filtered.
There's also a legal problem with curation that's got sharper recently and most brands don't know about it.
Filtering out negative reviews, or only asking happy customers to review (the industry calls that review gating), is banned under UK competition rules and captured by Australian consumer law. It's separately against Google's own product ratings policy.
Australia has decided case law on it. A health booking platform was fined $2.9 million partly for not publishing negative patient reviews and editing negative content out of others.
Check whether your review app is gating
Several review apps ship a flow that surveys customers first and only sends the public review request to people who rated you well. If your app offers "only ask customers who rated 4 or above", switching that on breaches Google's policy regardless of what the app's marketing says.
I'll write up the legal side properly another time, because it's a whole article on its own.
The widget I'd actually pick
We've used a fair few of these. Judge.me, Trustpilot, Klaviyo Reviews, a couple of others.
The one I like most is Okendo.
It costs more than the budget options and I'd only push it on brands who are going to genuinely work at their reviews.
But it has a proper API, and the widgets can be broken up and restyled and dropped into different parts of the page.
Most of the cheaper apps hand you an iframe you can't touch, which means every piece of placement advice in this article is off the table before you start.
That's the actual argument for it. The feature list is beside the point.
Okendo also captures structured attributes, so a fit or firmness or skin type rating comes through as data rather than sitting buried in review text. That turns your review pile into something you can build tests around.
Judge.me Free tier, ~£15/mo paid
- Lightest bundle of the major apps, roughly 30-60KB
- Free plan is genuinely usable
- Widgets look dated out of the box
- Fine default if reviews aren't a priority yet
Okendo Higher price point
- Proper API, widgets can be split and restyled
- Structured attributes flow into Klaviyo
- Lets you actually control placement
- Custom attributes don't transfer if you migrate away
Yotpo Enterprise pricing
- Heaviest bundle, reportedly 200-400KB per page
- Photo and video gated behind higher tiers
- Cost is the consistent complaint from merchants
On page speed, I'd take the widget bloat argument with a grain of salt. It's real, and Yotpo is genuinely heavy, but every source producing millisecond figures and dollar estimates is selling either a speed app or a competing review app.
I couldn't find a single controlled test anywhere of a store removing reviews for speed reasons and gaining conversion.
Lazy load the widget and render the star average as static markup. That's the fix.
What I'd test first
If you're starting from nothing, collect reviews before you worry about where they sit. Obviously.
If you already have them, the order I'd go in is roughly:
- Get the star rating and review count above the fold on mobile, linked down to the reviews
- Move reviews out of any horizontal tab into a vertical section
- Kill any mobile subpage or full screen takeover for reviews
- Add rating and review count to collection page tiles, after checking your ratings actually vary
- Wire up the ratings distribution bars so people can filter by star rating (about 90% of users try to click those bars and only 61% of sites let them)
The first two are the ones I'd expect to move something.
If you don't have the traffic to test them cleanly, there are ways around that, though honestly with the tab one I'd just ship it.
As for the massage table people, they're collecting reviews now. Took a while.
Common questions about product reviews and conversion
How many product reviews do you need before they help conversion?
One review beats zero by a measurable margin. Five to ten per product clears the basic credibility threshold, which is where most of the psychological effect sits. Beyond that returns diminish sharply, though around a third of shoppers say they want to see more than 100 reviews before trusting a product, so high-ticket hero products justify a bigger push.
Where should reviews go on a Shopify product page?
Put the star rating and review count near the product title, above the fold on mobile, linked down to the full review section. Keep the review block itself in a vertical section rather than a horizontal tab. Users overlook tabbed content 27% of the time against 8% for vertical sections, and product reviews are one of the tabs they miss most often.
Is a 5.0 star rating bad for conversion?
A 5.0 with few reviews reads as suspicious to a lot of shoppers. Average ratings across marketplaces have inflated over time without satisfaction improving, so shoppers now discount near-perfect scores. 54% name a mix of positive and negative reviews as their main signal that reviews are genuine. Don't engineer your rating downward, just stop filtering.
Are Trustpilot reviews enough, or do you need product reviews?
They do different jobs. Trustpilot builds brand-level trust and answers questions about shipping, returns, service and whether you're a real company. Product reviews answer whether this specific item is any good, which is the question someone has while looking at a product page. Brands running only Trustpilot usually have product pages with no proof on them at all.
Which Shopify review app is best for conversion optimisation?
Okendo, if you're going to actively work on your reviews. It has an API and restyleable widgets, so you can put review content wherever it performs rather than accepting a fixed iframe. Judge.me is the better default for brands not ready to invest, since the free tier works and the script is light. Yotpo is the heaviest and most expensive.
Does hiding negative reviews increase conversion?
No, and it carries legal exposure. Shoppers actively go looking for negative reviews, and 44% of the youngest cohort say they'd distrust a review section with no negatives at all. Review gating is banned by Google policy and captured by UK and Australian consumer law. Australia has produced multi-million dollar penalties for it.
Sources
- How Online Reviews Influence Sales, Spiegel Research Center, Northwestern (announced 2015, republished 2017)
- Reviews, Reputation, and Revenue: The Case of Yelp.com, Michael Luca, Harvard Business School
- Learning from the Crowd: Regression Discontinuity Estimates of the Effects of an Online Review Database, Anderson and Magruder, The Economic Journal, 2012
- The Effect of Electronic Word of Mouth on Sales: A Meta-Analytic Review, Babic Rosario et al., Journal of Marketing Research, 2016
- A Meta-Analysis of Electronic Word-of-Mouth Elasticity, You, Vadakkepatt and Joshi, Journal of Marketing, 2015
- Reputation Inflation, Filippas, Horton and Golden, Marketing Science, 2022
- Avoid Horizontal Tabs on Product Pages, Baymard Institute
- Always Show the Number of User Ratings in List Items, Baymard Institute
- 5 Requirements for the Ratings Distribution Summary, Baymard Institute
- Mobile UX: Avoid Subpages on Product Pages, Baymard Institute
- Ecommerce Review A/B Test Case Study, GrowthRock
- Do Reviews Really Improve Your Conversion Rate?, StackTome
- The Impact of Review Volume on Conversion, PowerReviews
- The Power of Review Volume and Recency, PowerReviews
- How Shoppers Navigate AI and Authenticity, Bizrate Insights, November 2025
- Customer Star Ratings pattern, GoodUI
- ACCC guidance on online product reviews, Australian Competition and Consumer Commission