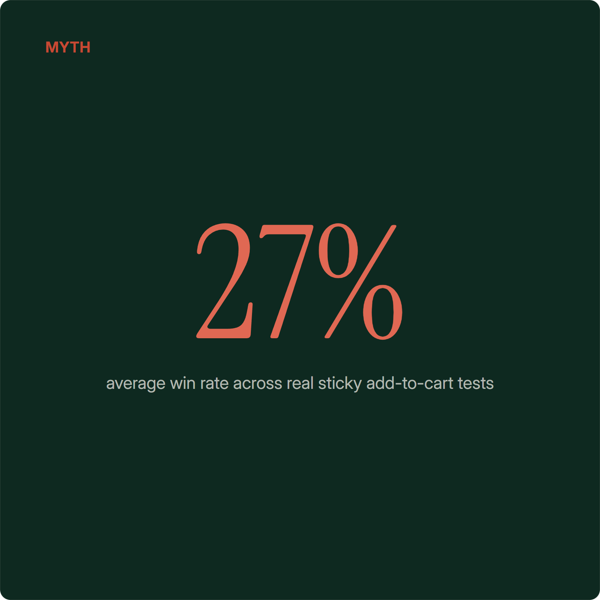
 Talk to a human
Does Site Speed Actually Increase Conversion Rate?

I've had a few brands come to me over the years asking about going headless.
Every time it's the same setup. They're doing two or three million a year, the founder isn't technical, and someone on LinkedIn has convinced them that site speed is the whole game. Go headless like the big retailers did. Store gets faster, conversion rate goes up, everyone's happy.
I've also worked with brands that already made that jump. A couple of them were pretty disappointed and we actually helped them move back to a monolithic setup. The overhead was brutal and the speed gains never showed up in revenue.
But this isn't a story about going headless, it's a question of whether spending a bunch of money to make your website faster is a good investment and actually moves your conversion rate.
In these situations where brand owners were pushing to go headless, I kept coming back to the same question - does site speed actually do all the things people say it does?
To be honest, I didn't want to know the answer. Going headless is expensive, and it was looking good for our bank balance. But now that we've moved away from that model and I've matured a bit, I can publicly ask the question!
Every CRO person, me included, will tell you to sort out your Core Web Vitals early. Developers chase those scores like there's nothing else on the roadmap. 100 out of 100 on PageSpeed and the job's done.
But does it move your conversion rate from 2% to 2.5%?
I went and dug through the research properly. Traced the famous stats back to where they came from, read the controlled experiments and went looking for anything that studied stores the size of the ones I work on.
My honest answer is no. Not at your scale.
This one is going to annoy a few developers.
Where the "speed is everything" idea comes from
Four numbers do pretty much all the work in this space.
Amazon found every 100ms of latency cost them 1% in sales. Google found half a second of delay dropped traffic 20%. Walmart found every second of improvement was worth 2% more conversions. And 53% of mobile visitors leave if a page takes longer than three seconds.
You've seen all of them. They're in every speed optimisation deck, every headless agency landing page and every LinkedIn post about performance.
I'd quoted a couple of them myself, which is partly why I went looking for the actual studies.
The Amazon stat has never been published

The Amazon number comes from a guy called Greg Linden. He worked there until 2002 and wrote a blog post in 2006 recapping a talk by Marissa Mayer.
What he actually wrote was that delaying the page in 100ms increments produced "substantial and costly drops in revenue".
That's the whole thing. The 1% figure isn't in it. That number only ever appeared on a slide in a lecture deck, with no sample size, no dates and no methodology. There has never been a published study behind the most-quoted statistic in conversion optimisation.
Since Linden left Amazon in 2002, the tests behind it probably ran somewhere between 2000 and 2002. That's dial-up era Amazon. A site with nothing in common with a Shopify store in 2026.
The Google stat from that same blog post is worse. The 20% traffic drop came from an experiment where Mayer changed search results from 10 per page to 30. Load time went from 0.4s to 0.9s as a side effect. So they were testing the number of results. The speed change came along for the ride.
Ron Kohavi, who ran experimentation at Bing and wrote the book most experimentation people learn from, uses that exact study as a teaching example of confounding.
Google's own properly randomised delay test in 2009 found 400ms of added delay cost about 0.6% of searches. For the Mayer number to hold, the next 100ms would have to cost another 19%.
Every big number in this space is a correlation
Once I sorted the research by how each study was actually run, the pattern showed up straight away.
Studies where someone deliberately slowed a site down and randomised who got the slow version produce small effects.
Studies where someone looked at their analytics and compared fast sessions against slow sessions produce enormous ones.
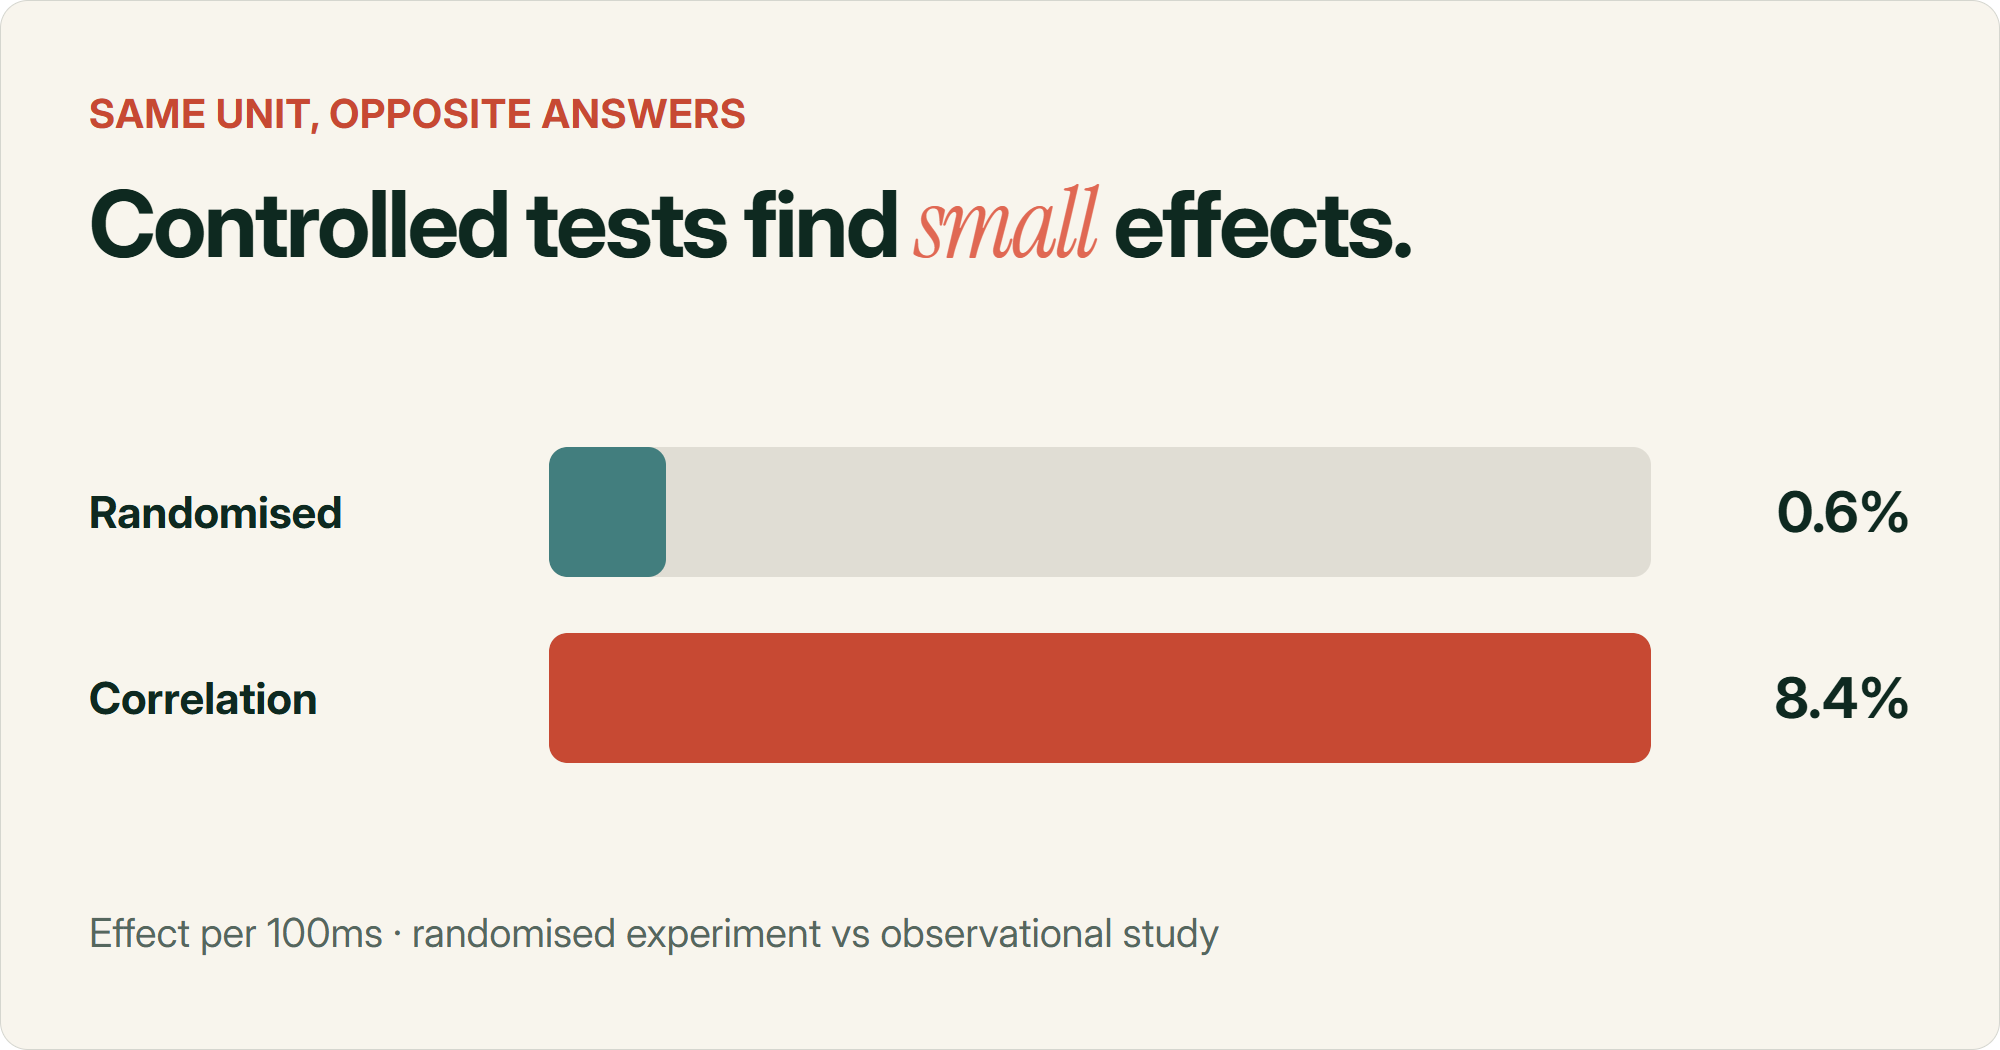
Bing ran the best version of the first kind. They slowed 10% of users by 100ms and another 10% by 250ms, ran it for two weeks and measured around 0.6% of revenue per 100ms.
Deloitte and Google ran the best version of the second kind. 37 brands, 30 million sessions, and they reported 8.4% more retail conversions per 100ms.
Same unit. Fourteen times the effect.
0.6% Revenue per 100ms, measured by randomised experiment (Bing)8.4% Conversions per 100ms, measured by correlation (Deloitte/Google)
That gap is what confounding looks like.
The mechanism is pretty simple once you see it. Someone who's going to buy loads more pages, and pages two through eight come off a warm cache so they're quick. Someone who bounces loads one page, cold, which is the slowest page anyone ever sees.
So buyers have faster sessions because they bought. The speed didn't cause anything.
Walmart's famous chart is exactly that shape. Converting sessions averaged 3.22 seconds and non-converting sessions averaged 6.03. Tammy Everts, who first published the chart, has said plainly that it's a correlation and was never meant to show cause.
There's a sampling problem on top of that which took me a while to get my head around. Simon Hearne wrote about it in 2022. The users having the worst experience leave before your analytics script fires, so they never make it into your data at all. On Chrome Android at a 4 second first paint, roughly 17% of users are missing. Every load-time-versus-conversion chart ever drawn is built from the people who stuck around.
Why it genuinely works for Amazon and Temu
None of this means speed does nothing. It clearly does something. The direction has held up in every controlled experiment anyone has run, and I'm not arguing with the sign.
The problem is who those experiments were run on.
Bing, Google, Amazon and Temu are playing a completely different game to a Shopify brand doing $5M. Two reasons.
They've already taken the easy wins. Every obvious thing you'd do to lift a conversion rate got done years ago. They're deep into creative AOV mechanics and personalisation systems most brands will never build. Milliseconds are what's left on the list.
And they can actually measure it. Kohavi has said that at Bing every 0.1 second was worth about $18 million a year, and that four milliseconds of improvement could fund an engineer for a year.
$18M What 0.1 seconds was worth per year at Bing, which is why they could justify chasing it
When you're serving millions of sessions an hour, a 0.5% effect is both detectable and worth nine figures.
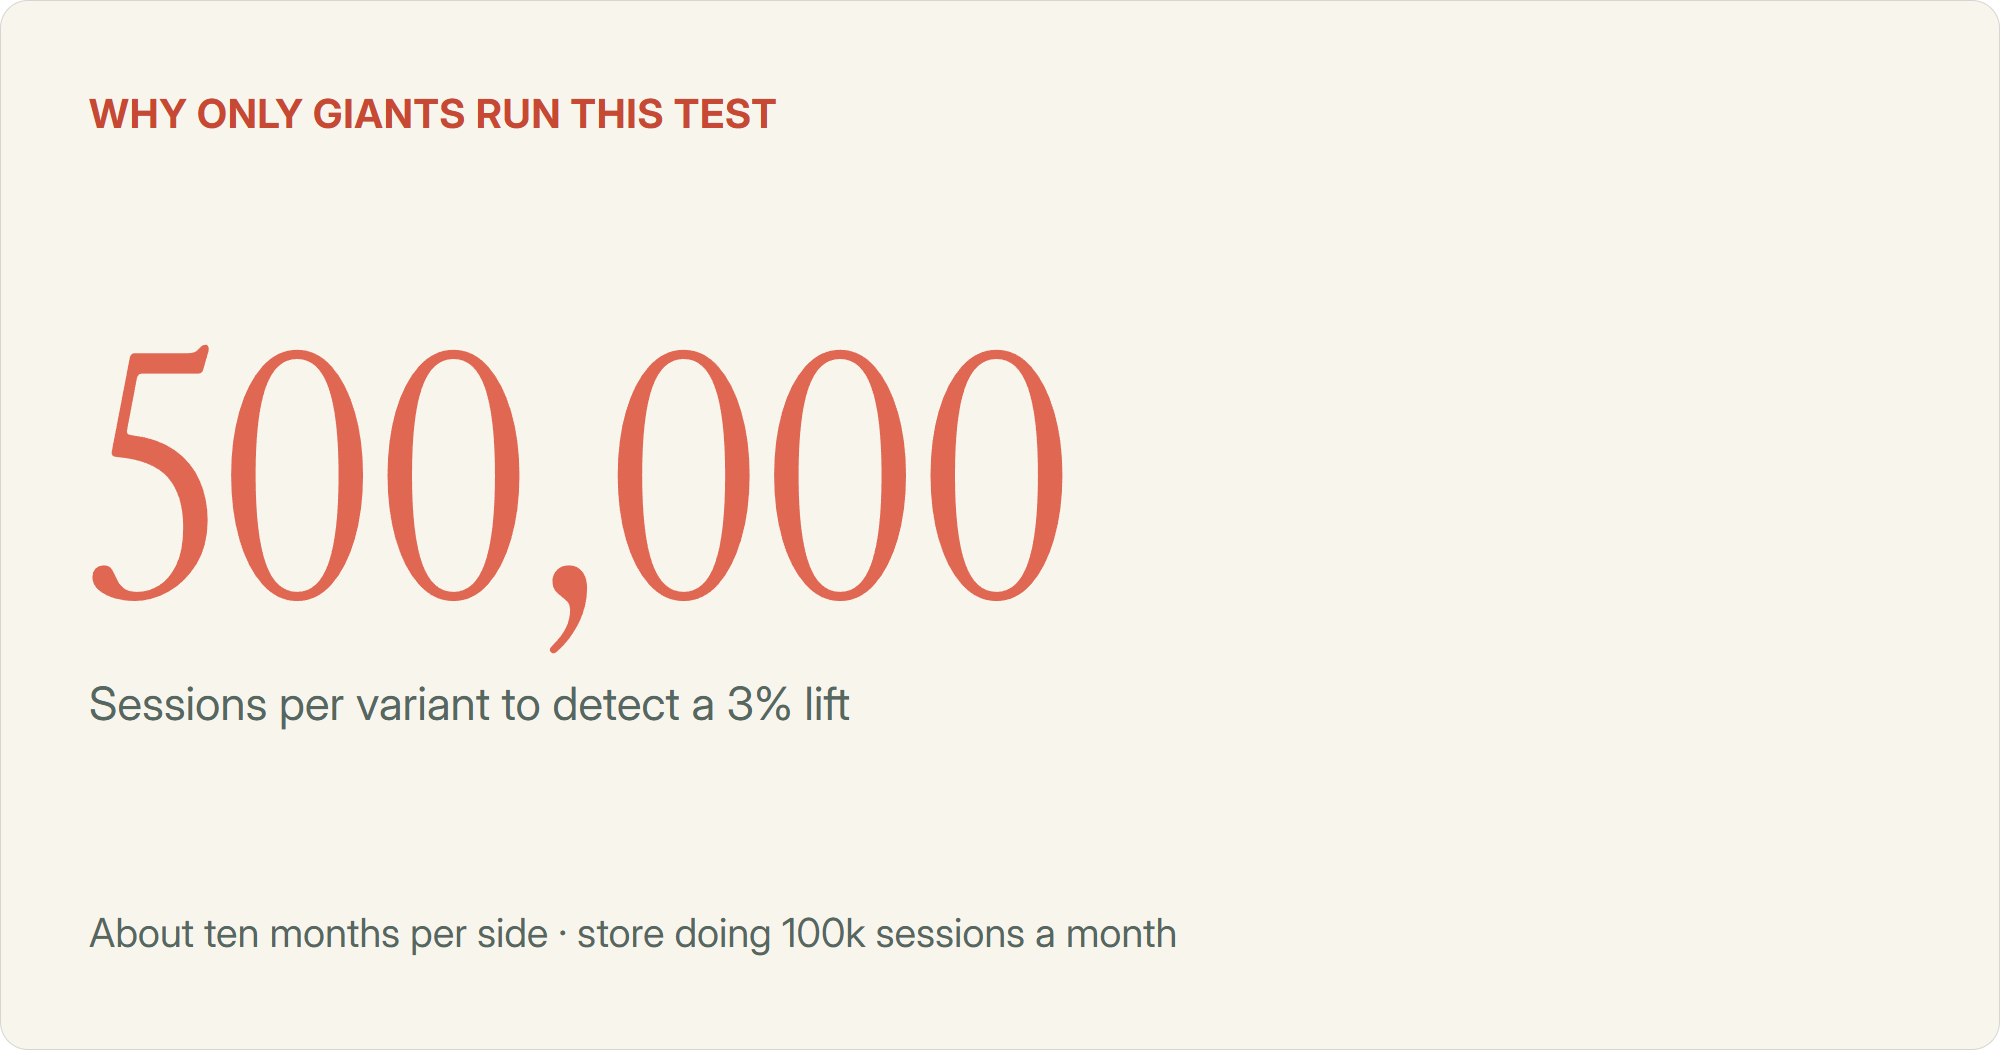
Run that maths on a store doing 100,000 sessions a month. To detect a 3% relative lift on a 2.5% conversion rate you need somewhere around 500,000 sessions per variant. That's about ten months per side.
And to do it properly you'd have to deliberately slow half your customers down for most of a year.
That's why these experiments only exist at Amazon and Microsoft scale. It's the same minimum detectable effect problem that makes A/B testing hard on lower traffic stores, just far worse.
Nobody has run this test on a store your size
I went looking specifically for a controlled speed test on a store under $50 million. Agency case study, vendor blog, academic paper, engineering post. Anywhere.
There isn't one.
Everything at that scale is either a correlation across a bunch of different stores, or a before-and-after with no control group where the site got rebuilt and twenty other things changed at the same time.
The closest thing I found to a real experiment on a normal store is a null result. Someone ran four groups on a Magento store with 0, 1, 2 and 3 seconds of delay added, and reported almost no difference in conversion between them. No sample size published, so it's weak evidence. But it's the only test anywhere that resembles the stores I work on, and it points the opposite way to every vendor blog on the internet.
Correlations at this scale do exist, and plenty of them. Shopify published one in April across its own merchant base, which is mostly stores under $50M. They found 3.5% lower conversion for every extra 100ms of LCP.
Read the fine print though. Shopify compared different stores against different stores. They say themselves that it's a correlation and not a demonstration of cause. Fast stores also happen to be the stores with fewer junk apps, better developers, cleaner themes and better product-market fit. You're measuring "well run business" and putting the credit on speed.
Shopify also sells web performance services, which is worth knowing when you're reading Shopify's study about web performance.
The other thing I noticed: I couldn't find a single published case of a speed project that didn't work. Not one. Every search for a null came back with case studies where it went well.
That's not because failures don't happen. Nobody writes a blog post about the three months they spent on performance for no return. The people producing this research are CDNs, performance vendors, agencies selling the fix and Google. None of them have a reason to publish a flop.
Your store is probably already fast enough
This was the part that surprised me most.
76% of Shopify stores pass all three Core Web Vitals. Across the whole web it's 48%. The median Shopify store runs a mobile LCP of 2.26 seconds, which sits inside Google's "good" threshold.
76% Shopify stores passing all three Core Web Vitals48% All websites passing all three Core Web Vitals
Your average Shopify store is already in the top third of the internet on performance.
So why does everyone think their store is slow?
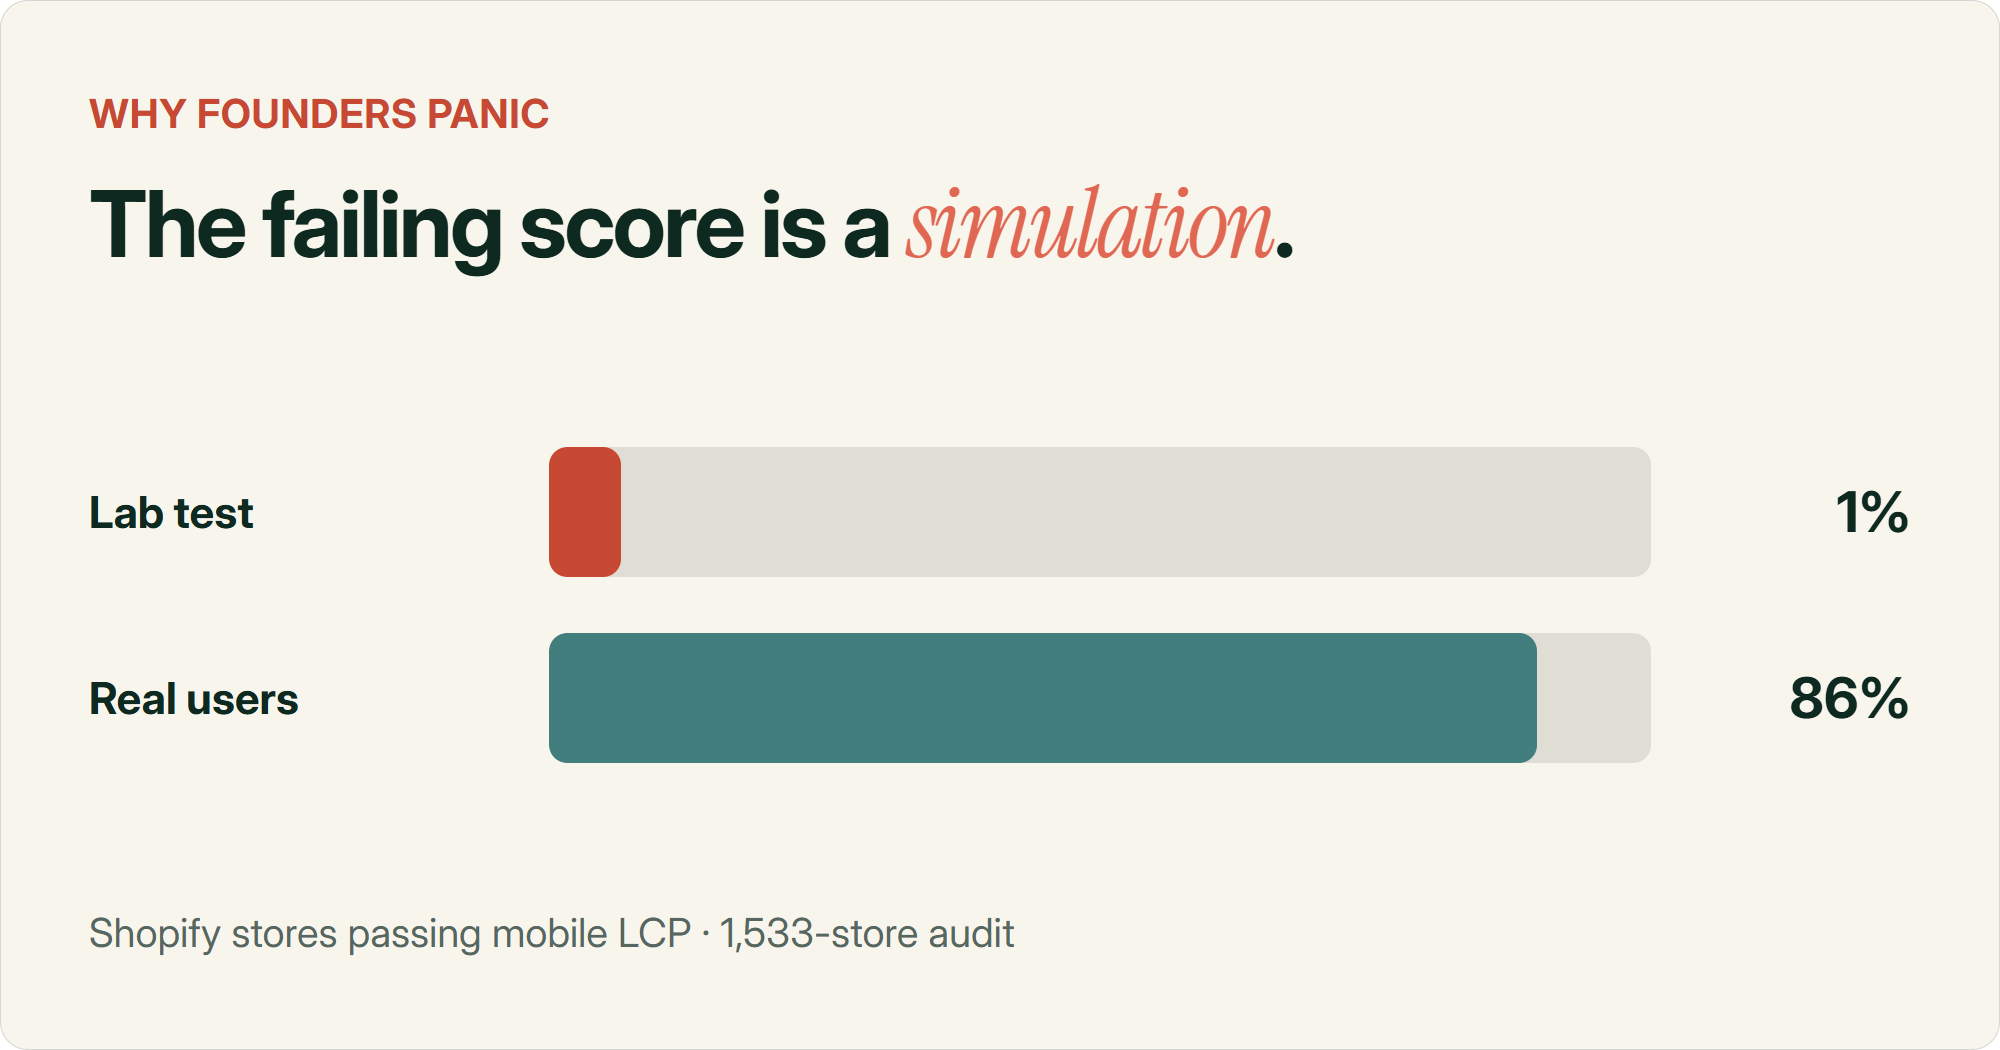
Because they're looking at the wrong number. One audit of 1,533 stores found about 1% pass Lighthouse's lab test for mobile LCP, while about 86% pass on real user data.
Lighthouse mobile simulates a throttled mid-range Android on slow 4G. It's much harsher than the phone your actual customer is holding. So nearly every store fails the lab test and nearly every store passes in the field.
Check the field data before you spend a dollar
Run your store through PageSpeed Insights and scroll to the section at the top labelled "Discover what your real users are experiencing". That's Chrome field data from actual visitors. If it's green, you don't have a speed problem worth funding. The big score underneath it is a simulation, and it's the number that makes founders panic. Here's a longer walkthrough on measuring Core Web Vitals properly.
The Shopify admin speed score has the same problem, and Shopify is unusually blunt about it. Their own docs say the real-world performance of your store is what impacts conversion, and that the speed score isn't directly correlated to actual speed. They invoke Goodhart's law by name and warn that some tactics improve the score while making the experience worse.
Healthy, well-run stores routinely sit in the 20 to 35 range on that score. I've watched founders lose sleep over it.
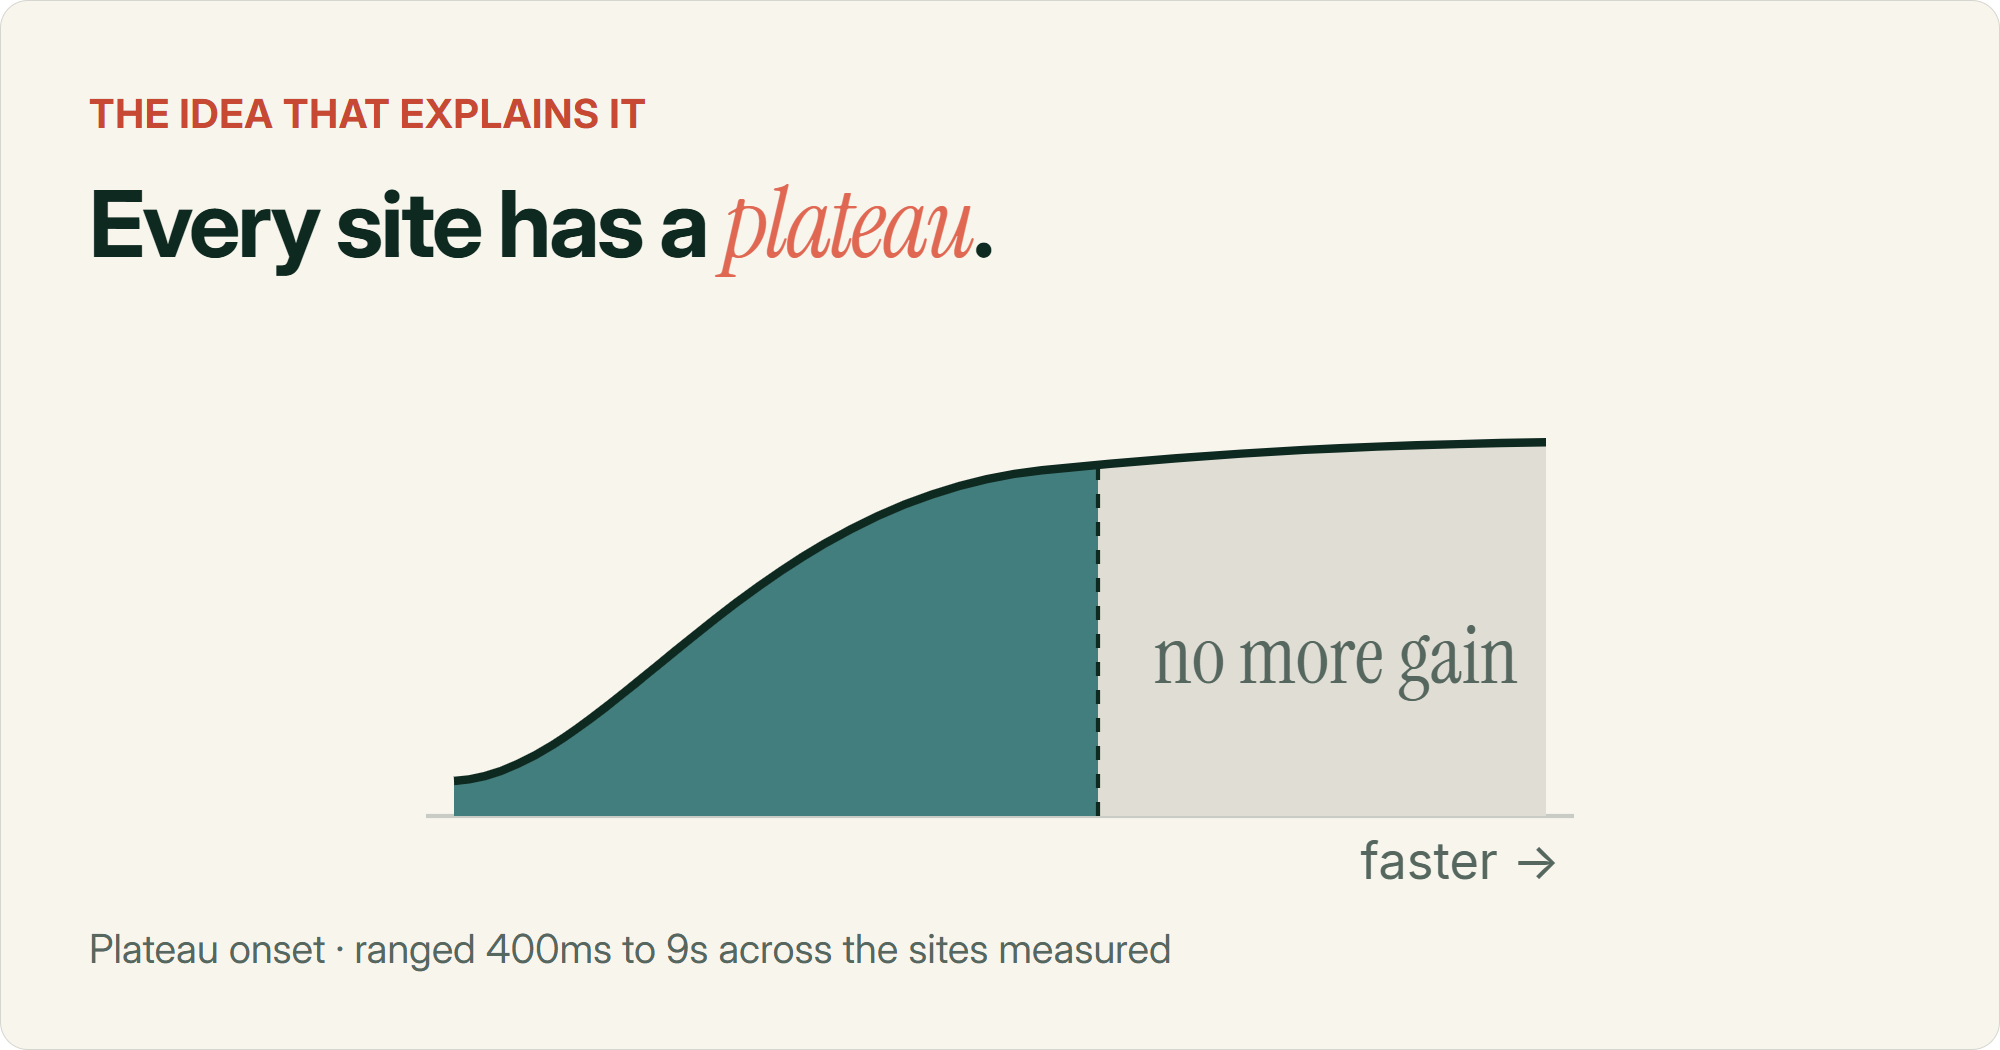
The idea that tied all of this together for me is what SpeedCurve calls the performance plateau. Every site has a point where getting faster stops moving business metrics. They found one on every site they analysed, but the point sat anywhere between 400 milliseconds and 9 seconds depending on the site.
On some sites the plateau starts before the median session, meaning most of the traffic is already in the zone where more speed does nothing at all.
A more recent analysis across ten retailers found four of them had already flattened out before they even reached Google's 2.5 second LCP threshold.
So the real answer to "will getting faster help my store" is that it depends where you sit on your own curve, and no benchmark can tell you that.
So should you go headless?
Back to the thing that started all this.
A proper Hydrogen build runs $80,000 to $250,000 over three to six months, plus $15,000 to $30,000 a month to keep a team on it.
The best argument against it comes from a company that sells headless Shopify tooling. Their own pricing guide says payback for brands doing $5M to $20M lands at 12 to 18 months, and that below $5M the same budget spent on CRO and acquisition usually returns 3 to 5 times more.
When the vendor tells you not to buy the thing, believe them.
There's also a fair argument that headless Shopify stores often convert worse than a well-built Liquid theme. Dawn is quick out of the box. Hydrogen only beats it when someone is actively tuning server-side rendering and edge caching, which is exactly the ongoing overhead the brands I've spoken to got sick of paying for.
App and tag cleanup $500 - $2,500
- Strip redundant apps and orphaned code
- Image compression and script deferral
- Recovers 1-2s on a bloated store
- Where nearly all the achievable gain lives
Full optimisation $2,000 - $8,000
- Real Core Web Vitals movement on your existing theme
- Roughly one month of a standard CRO retainer
- Worth it only if field data says you're slow
Theme rebuild $10,000 - $50,000
- Substantial rewrite
- Equal to 6-12 months of structured testing
- Hard to justify on a speed business case
Headless / Hydrogen $80,000 - $250,000
- Plus $15-30k a month for the team
- 2-4 dedicated React developers
- Vendors themselves say don't, under $5M
When speed actually is the problem
I want to be fair here, because there's a version of this where speed is the entire problem.
If your store is properly broken, go fix it. Pages timing out, 6 second loads on mobile, images that never finish, a checkout that hangs. That's a bug, and it needs a developer today.
Most of the case studies where speed produced a huge lift are exactly this. The site was severely broken and someone got it back to normal. Going from cooked to fine is worth real money. Going from fine to slightly better is where the return disappears.
The triage rule I'd use
Above 5-6 seconds mobile LCP in field data, stop everything else and fix it. Between 2.5 and 5 seconds, do the cheap tier of work and nothing more. Under 2.5 seconds, leave it alone and go work on your offer.
Worth knowing that speed can lose to other things and that's fine. Blue Triangle documented a beauty retailer that A/B tested a redesign which was 1.5 seconds slower on key pages. It converted better anyway. Leadership wanted to roll it back purely on the speed regression, and the nicer, more usable site won.
That matters for anyone running tests. A variant that adds a size guide or a decent product video will slow the page down and can still win.
Where I'd put the money instead

If a client insists on spending something on performance, this is the order I'd do it in.
Pull the field data Chrome user data in PageSpeed Insights, on mobile. Ignore the lab score entirely.Segment the funnel by load speed If people are leaking at checkout rather than bouncing on landing, speed isn't your problem.Bisect your apps Disable everything in a staging theme, measure, then switch them back on one at a time.Clean the tags, then stop Kill duplicate pixels and unused scripts in GTM. Resist the urge to keep going.
That audit of 1,533 stores found the number of third-party services on a homepage correlates -0.66 with mobile performance, which was the strongest single relationship in their whole dataset. The median store runs 21 to 30 of them. Google Tag Manager on its own had a median of 486ms of main thread blocking.
Analytics and marketing tags do most of the damage. Review widgets and checkout apps barely register, which is the opposite of what most people rip out first.
Tag cleanup runs $500 to $2,500 and buys back a second or two on a bloated store. It costs less than a single A/B test cycle and carries almost no downside, because nobody buys less when you delete a duplicate pixel.
One warning though. Deferring or lazy-loading your conversion tags to win LCP points degrades the signal going back to Meta and Google. You can lose real money while your Lighthouse score improves.
There's one argument for speed work that I think is genuinely underrated, and nobody puts it in a pitch deck.
Heavy stores make testing harder. Client-side testing tools add their own script weight on top of yours. Flicker gets worse, so people in your treatment group see the control render first and you end up measuring a glitch instead of your hypothesis. Load time variance widens your confidence intervals, which means longer tests and fewer of them per year.
So if you're about to start a testing programme on a bloated theme, spending $2,000 on cleanup first is defensible. Just be honest with yourself that you're buying test reliability. The conversion lift is a maybe.
The thing I keep landing on is that site speed became a proxy for doing a good job. It's measurable, it's technical, there's a score out of 100 and you can prove you improved it. Your offer, your positioning and your product page content are all harder to measure and much harder to fix.
So people optimise the thing with the scoreboard on it.
If your store loads in a couple of seconds and you're still converting at 2%, speed isn't what's holding you back.
Common questions about site speed and conversion rate
Does page speed affect conversion rate?
Yes, but far less than the marketing stats suggest. Randomised experiments at Bing measured around 0.6% of revenue per 100ms, while correlational studies claim 7-8% per 100ms. The gap is confounding, because people who buy load more cached pages and look faster in your analytics. Direction is real, magnitude is oversold.
Is going headless worth it for a Shopify store?
Below roughly $5M in revenue, no. A Hydrogen build costs $80,000 to $250,000 plus $15,000 to $30,000 a month in ongoing team costs. Headless vendors themselves state that under $5M the same budget returns 3 to 5 times more in CRO and acquisition. Well-built Liquid themes like Dawn are fast by default.
What's a good LCP for a Shopify store?
The median Shopify store runs 2.26 seconds on mobile, and 76% pass all three Core Web Vitals. Google's "good" threshold is 2.5 seconds. If your field data is under that, you're ahead of most of the web and further speed work is unlikely to pay for itself.
Does the Shopify speed score matter?
Not much. Shopify's own documentation says the score "is not directly correlated to actual speed" and that real-world performance is what impacts conversion. It's a Lighthouse lab score across three pages under simulated conditions. Healthy stores routinely score 20 to 35. Use Chrome field data instead.
Do Core Web Vitals affect SEO rankings?
Weakly. John Mueller has said Core Web Vitals "are not giant factors in ranking" and that relevance matters far more. Google removed Page Experience from its documented ranking systems in 2023. Ahrefs found only 11.4% of pages even have the field data required for the signal to apply.
How much does Shopify speed optimisation cost?
App and tag cleanup runs $500 to $2,500 and recovers most of what's available on a bloated store. Full optimisation on an existing theme is $2,000 to $8,000. Theme rebuilds start around $10,000. Anything under $300 is someone emailing you a PageSpeed Insights screenshot.
Sources
- Marissa Mayer at Web 2.0. Greg Linden, 2006. The original source of both the Amazon and Google stats.
- Walmart web performance. Cliff Crocker, Velocity 2012. The slide deck behind the "1 second = 2% conversions" chart.
- Google: 53% of mobile users abandon sites that take over 3 seconds to load. Marketing Dive, 2016, reporting Google/SOASTA data.
- Seven Rules of Thumb for Web Site Experimenters. Kohavi, Deng, Longbotham & Xu, KDD 2014. The Bing slowdown experiment.
- Milliseconds Make Millions. Deloitte Digital & Google, 2020.
- Survivorship Bias in Web Performance. Simon Hearne, 2022.
- Why you need to know your site's performance plateau. Tammy Everts, SpeedCurve.
- The Core Web Vitals thresholds you trust might be wrong for your site. Embrace, 2026.
- Store Speed and Conversion: What the Data Shows. Shopify, 2026.
- What is a good Shopify speed score?. Shopify.
- Web Almanac 2025, Ecommerce chapter. HTTP Archive.
- Web Almanac 2025, Performance chapter. HTTP Archive. The 48% web-wide Core Web Vitals pass rate.
- Shopify performance audit of 1,533 stores. EcomHint, 2026.
- How Fast Should Your Ecommerce Site Be? Fast Enough.. Psyberware.
- Changes to new and existing ecommerce sites. Blue Triangle.
- Shopify headless pricing. Weaverse.
- Core Web Vitals study of 42M+ URLs. Ahrefs.