 Talk to a human
Statistical Significance in A/B Testing, Explained

I've played a lot of Catan.
Enough that I've noticed something weird about the dice.
Some games, the fives just won't stop coming. Every other roll, someone's collecting sheep. Other games it's eights, or that annoying run of elevens that always seems to happen right when you're one resource away from a city.
For years I half wondered if the dice were rigged, or if there was some pattern I wasn't seeing.
There isn't. Roll two dice enough times and you get the bell curve everyone learns about in school. Seven comes up the most because there are more ways to make it. Two and twelve barely show up because there's only one combination each.
But zoom in on a single game, twenty or thirty rolls, and that bell curve is nowhere to be seen. You get streaks. Clusters. Numbers that seem to defy the odds.
I bring this up because it's basically what happens inside an A/B test.
If you check your results after two days and your variant is smashing the control, it feels like you've found something real. Usually you haven't. You've just rolled a good streak of elevens.
And this is the exact spot where most ecommerce brands running their own tests get it wrong. It's got nothing to do with bad marketing instincts. It's that nobody ever taught them how the stats underneath actually work.
What Statistical Significance Is Actually Asking
A p-value is not complicated once you strip the jargon off it.
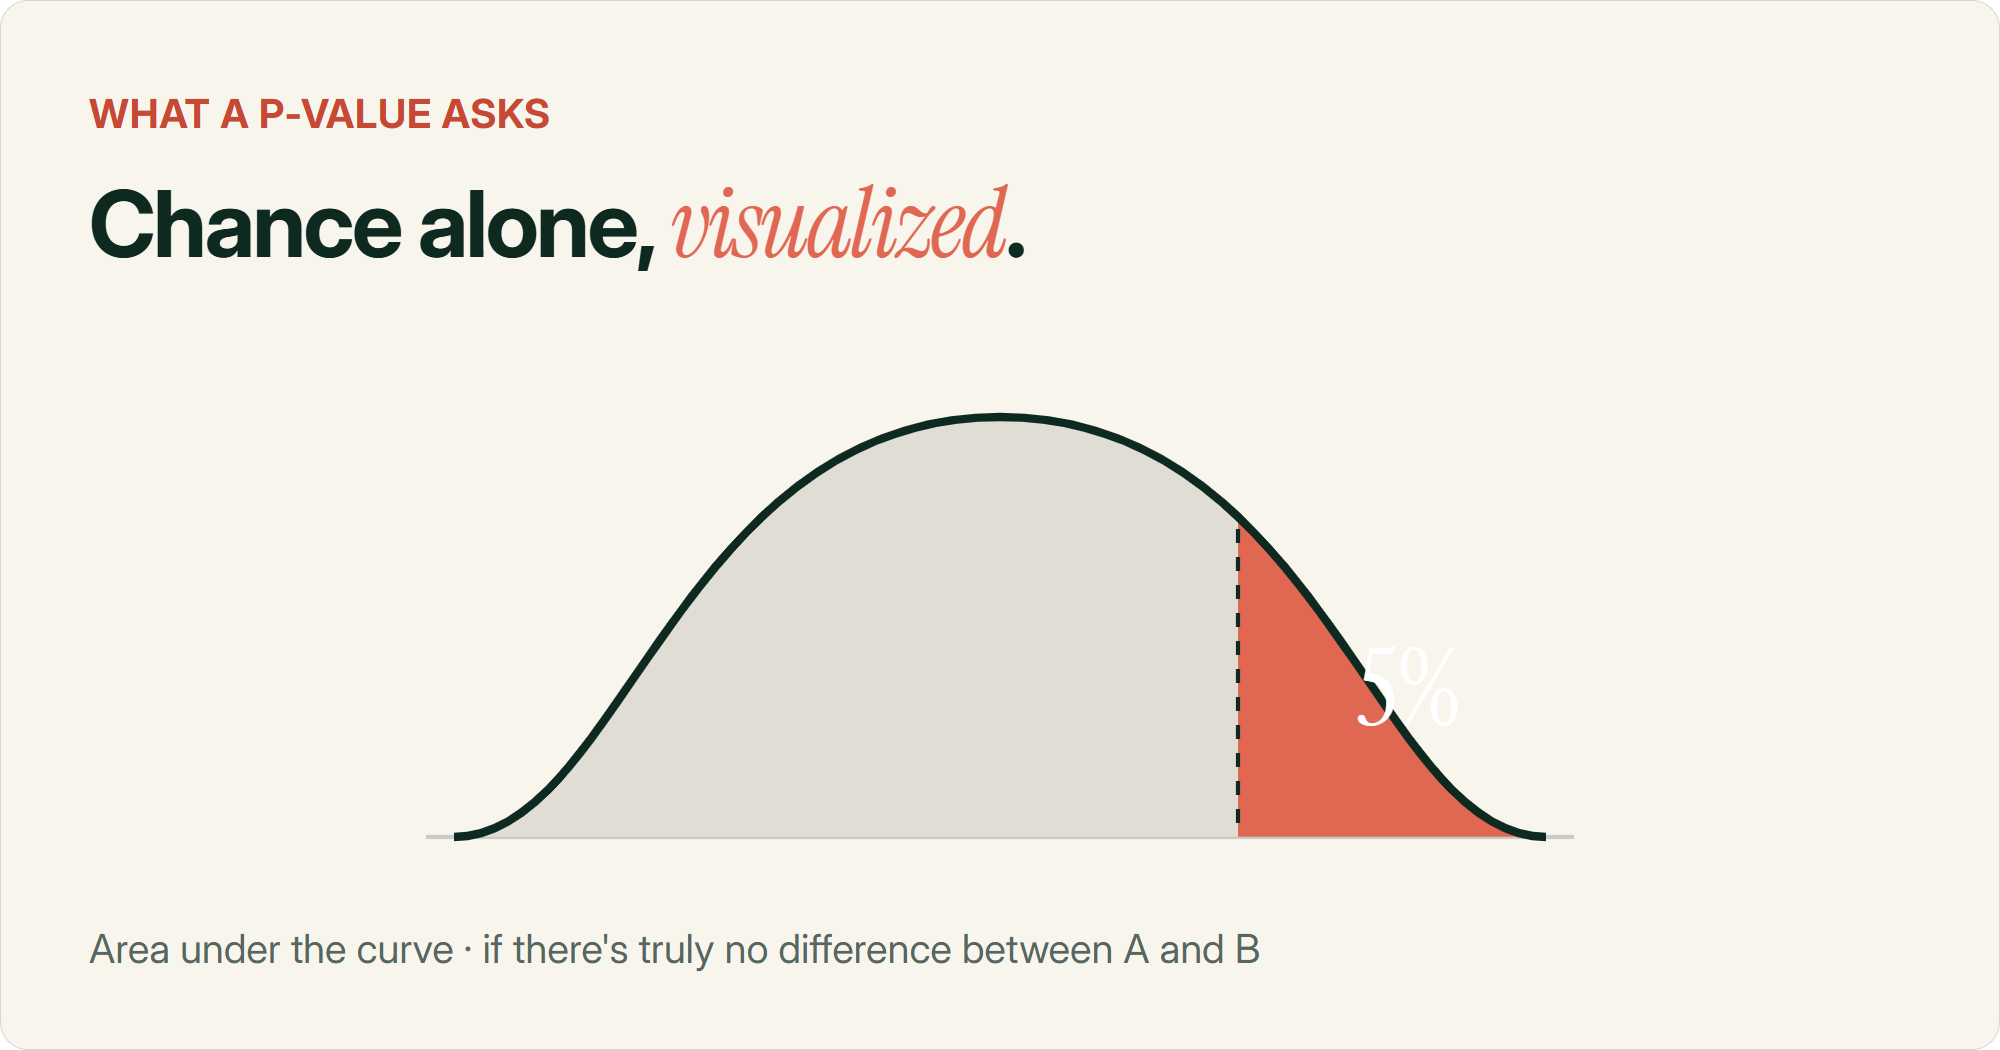
It's asking one question. Assuming there's actually no difference between your control and your variant, how surprising would it be to see a result like the one sitting in your dashboard right now.
Go back to the dice for a second. Rolling an eleven feels notable because there's only two ways to make it out of thirty six combinations. Rolling a seven barely registers because there's six ways to make that one. Same logic sits underneath a p-value. It's measuring how unlikely your result would be if nothing was actually going on.
The usual cutoff is 5%. If there's less than a 5% chance you'd see a result this extreme with nothing really happening, you call it statistically significant.
That's it. That's the whole concept.
It won't tell you if your variant's actually better, or if the lift sticks around next month. It's just a filter for noise.
Why Your Test Looks Like a Winner After Two Days
This is where the dice thing actually matters.
Roll two dice twenty times and you can easily get four elevens in a row. That doesn't mean elevens are secretly more likely. It means twenty rolls isn't enough data to see the real pattern yet.
Same thing happens two days into an A/B test. Your sample is tiny. A handful of extra conversions on the variant can make it look like you've found a massive winner, when really you've just caught a lucky streak.
The dangerous part is what happens if you check constantly and stop the moment it "turns green". You're not running one test anymore. You're running dozens of mini tests and cashing out the first time the dice go your way.
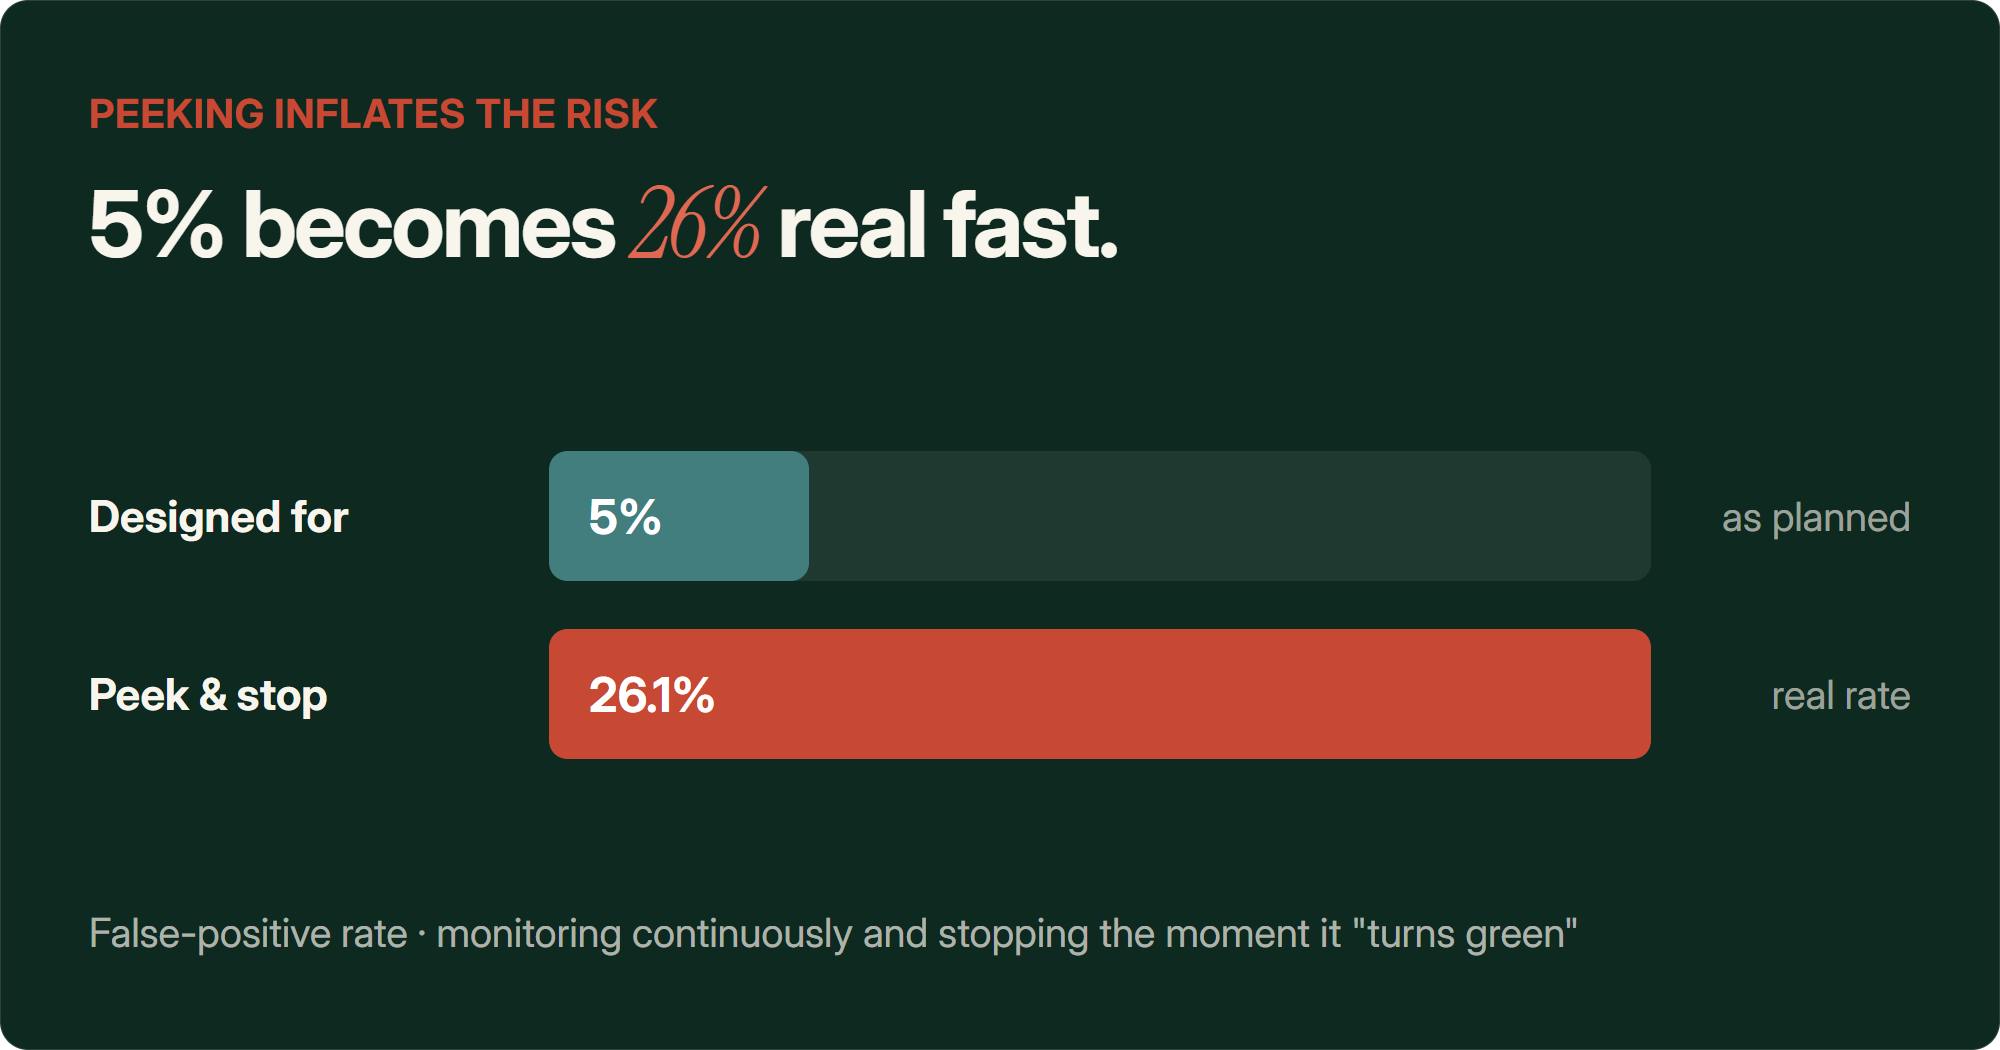
Evan Miller ran the numbers on this years ago and it's still the clearest explanation going. If you monitor a test continuously and stop the second you hit significance, your real false positive rate isn't 5%.
5% The false positive rate you think you're risking26.1% The real rate once you peek and stop early
Peep Laja, who's about as respected as anyone in this industry, has made a similar point about A/A tests specifically, where the control and the variant are literally identical. Keep checking one of those long enough and it'll eventually flash "significant" too, because there was never anything real to find. Just noise doing noise things.
I've written before about running an A/A test on a client's store for exactly this reason, as a sanity check on the testing setup itself. It's a good way to see this trap play out with your own eyes rather than trusting me on it.
Power Is Just Asking How Many Times You Need to Roll the Dice
If a p-value asks "was this surprising", power asks a different question. How many rolls do I need before I can trust what the dice are telling me.
Statistically, power is the probability that your test will actually detect a real effect if one exists. Run too few visitors through the test and you can have a genuine winner sitting in your data and still miss it, because the sample was too small to separate the signal from the noise.
There's a formula for working this out ahead of time and it's genuinely annoying to calculate by hand. More on the shortcut in a second.
What matters more day to day is the relationship between power and the size of the change you're testing. The bigger the swing you expect, the fewer rolls you need to see it clearly.
Test a 20% price change and you'd expect conversion rate to move a lot, so you don't need nearly as much traffic to detect it. Test a 1-2% tweak to your product page copy and you're asking the test to find a much smaller signal in the same amount of noise, which means it needs way more visitors and way more time.
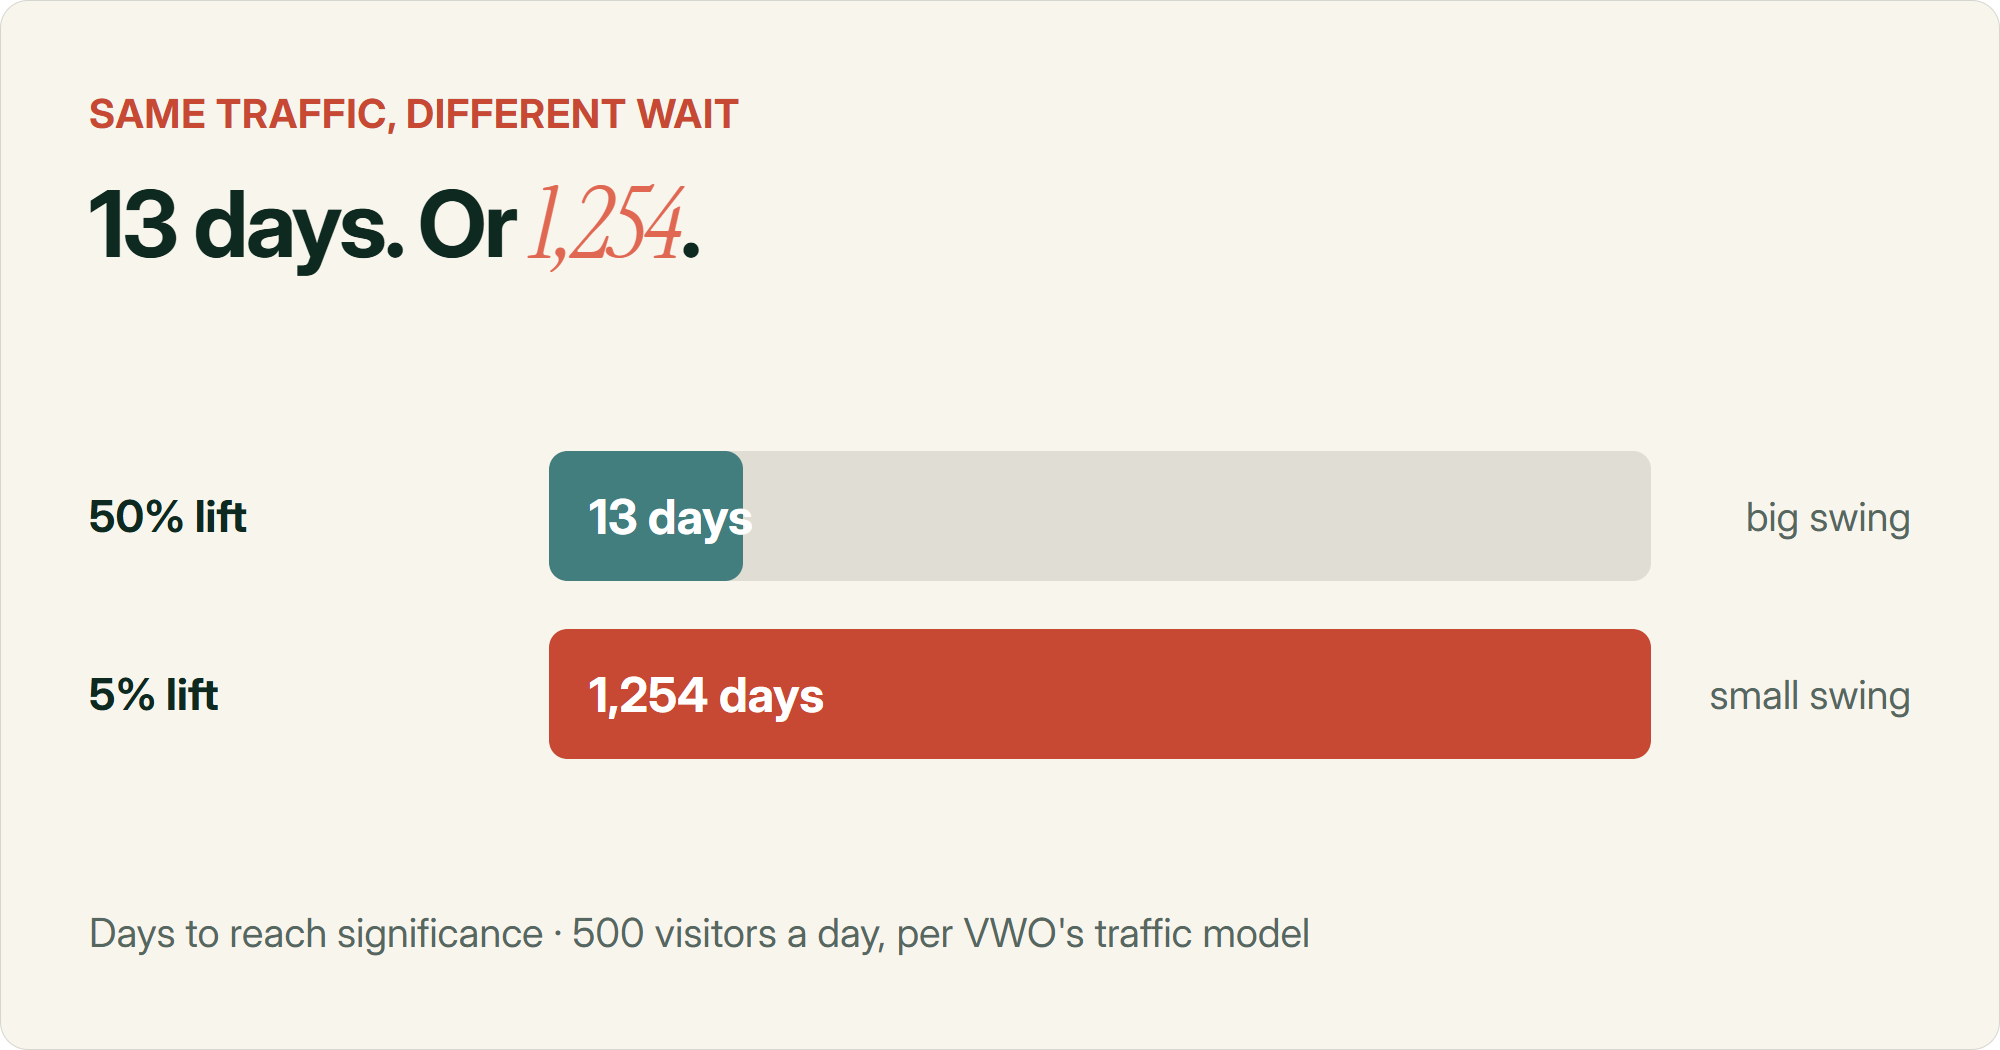
VWO ran the numbers on a low traffic site doing 500 visitors a day. Detecting a 50% lift took about 13 days. Detecting a 5% lift on the same traffic took an estimated 1,254 days.
13 days To detect a 50% lift at 500 visitors a day1,254 days To detect a 5% lift on the same traffic
That's not a rounding difference. That's the entire practical reality of testing on a smaller store.
I've written before about running pricing experiments, and this is exactly why price tests tend to reach significance faster than smaller cosmetic changes. Bigger economic swing, bigger signal, fewer rolls of the dice needed to see it.
The Brand That Argued With Its Own Testing Tool
I spoke to a brand not long ago that had this exact conversation with Convert, one of the bigger testing platforms.
They'd gotten on a support call asking why Convert's Bayesian model kept refusing to call their tests significant. The answer was simple. Their tests were underpowered. They needed to keep them running longer to actually reach a trustworthy result.
They didn't love that answer.
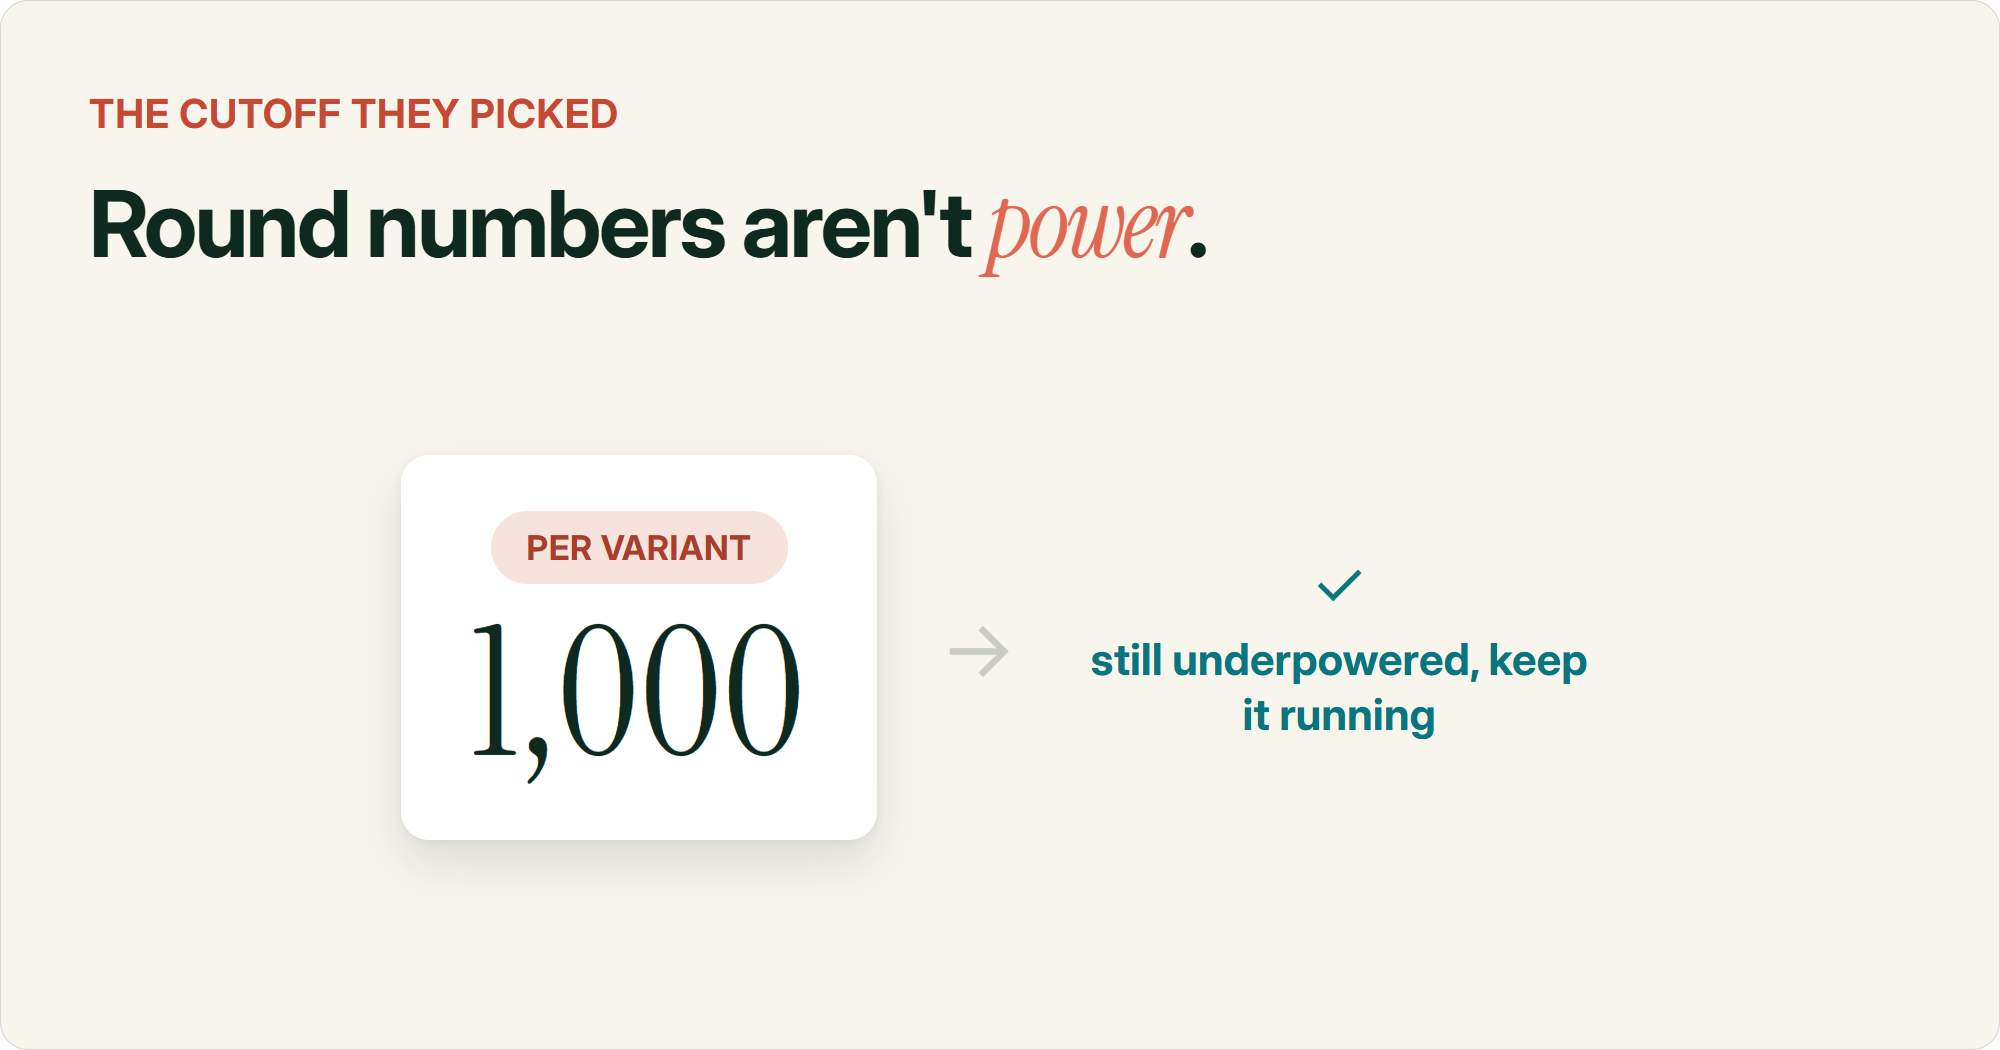
Instead they decided to just run every test until exactly 1,000 visitors had gone through the control and 1,000 through the variant, then call it regardless of what the stats said. Take their chances with whatever number came out.
Common mistake
Setting an arbitrary visitor cutoff, like "1,000 per variant no matter what", isn't a substitute for calculating the power your test actually needs. If the sample size doesn't match the effect you're trying to detect, the result isn't trustworthy no matter what round number you picked.
I get the instinct. Waiting is annoying and everyone wants an answer. But you can't set your own arbitrary cutoff and then get frustrated at the tool for "not working properly". If you want to make decisions off gut feel, that's a legitimate way to run a business and nobody's stopping you. What you can't do is point at a statistics engine that's trying to stop you fooling yourself and blame it for doing its job.
Pro tip
Drop your traffic numbers and conversion rate into Claude or ChatGPT, tell it the lift you're hoping to detect, and ask it to calculate the statistical power of your experiment. It'll estimate how long you need to run the test and how many conversions you need before the result actually means anything.
Conversions Matter More Than Visitors
There are proper formulas for all of this, but as a general rule, conversions matter more than raw visitor count.
If your conversion rate is low, you need to let the test run for longer. Full stop. It doesn't matter how much traffic is flowing through the page if barely any of it converts, because conversions are the actual unit the statistics are built on.
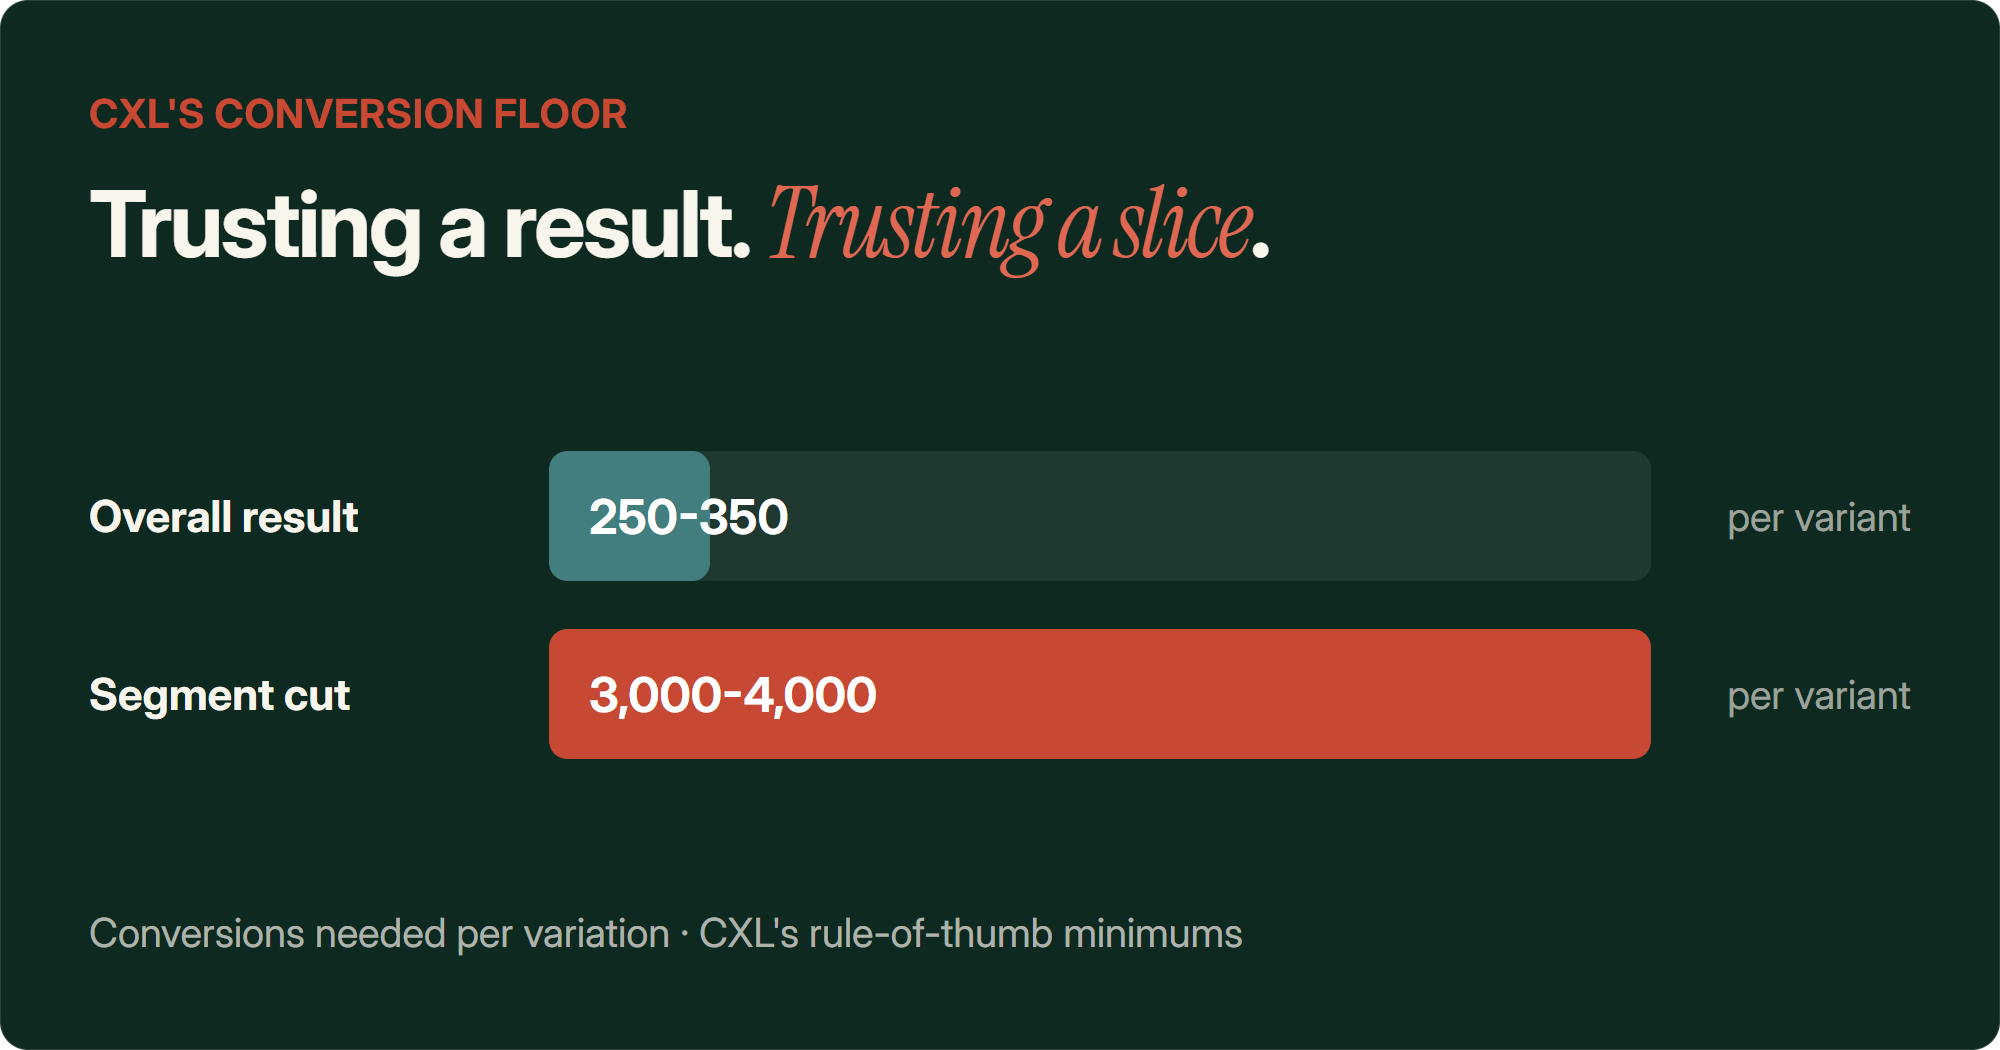
CXL's rule of thumb sits around 250 to 350 conversions per variation before you can call a result reliable, and closer to 3,000 to 4,000 per variation if you want to trust a segment cut inside that result.
250-350 Conversions per variation CXL treats as the minimum floor before trusting a result
Most Shopify stores never get near that on a single page test. Which is fine. It just means you need to be realistic about timelines, or shift what you're testing.
If you're running a lower traffic store and your tests keep coming back underpowered, I've written a separate guide on A/B testing without enough traffic that covers alternatives. And if purchase itself is too rare an event to test against directly, there's also an article on micro conversions that walks through testing against earlier, more frequent steps in the funnel instead.
Don't Go Snooping Through Segments After the Test Ends
This one trips up more experienced people too, not just brands running their first test.
You finish a test, it comes back flat or inconclusive, and then you start slicing it. Mobile versus desktop. New versus returning. All the usual segment splits.
Somewhere in there you find a segment that looks like a clear winner.
The problem is every single cut you make is basically another roll of the dice. At a normal 95% confidence level, Bell Statistics reckons you'll turn up a false positive roughly once every 20 segments you check, purely by chance, with nothing real going on underneath it.
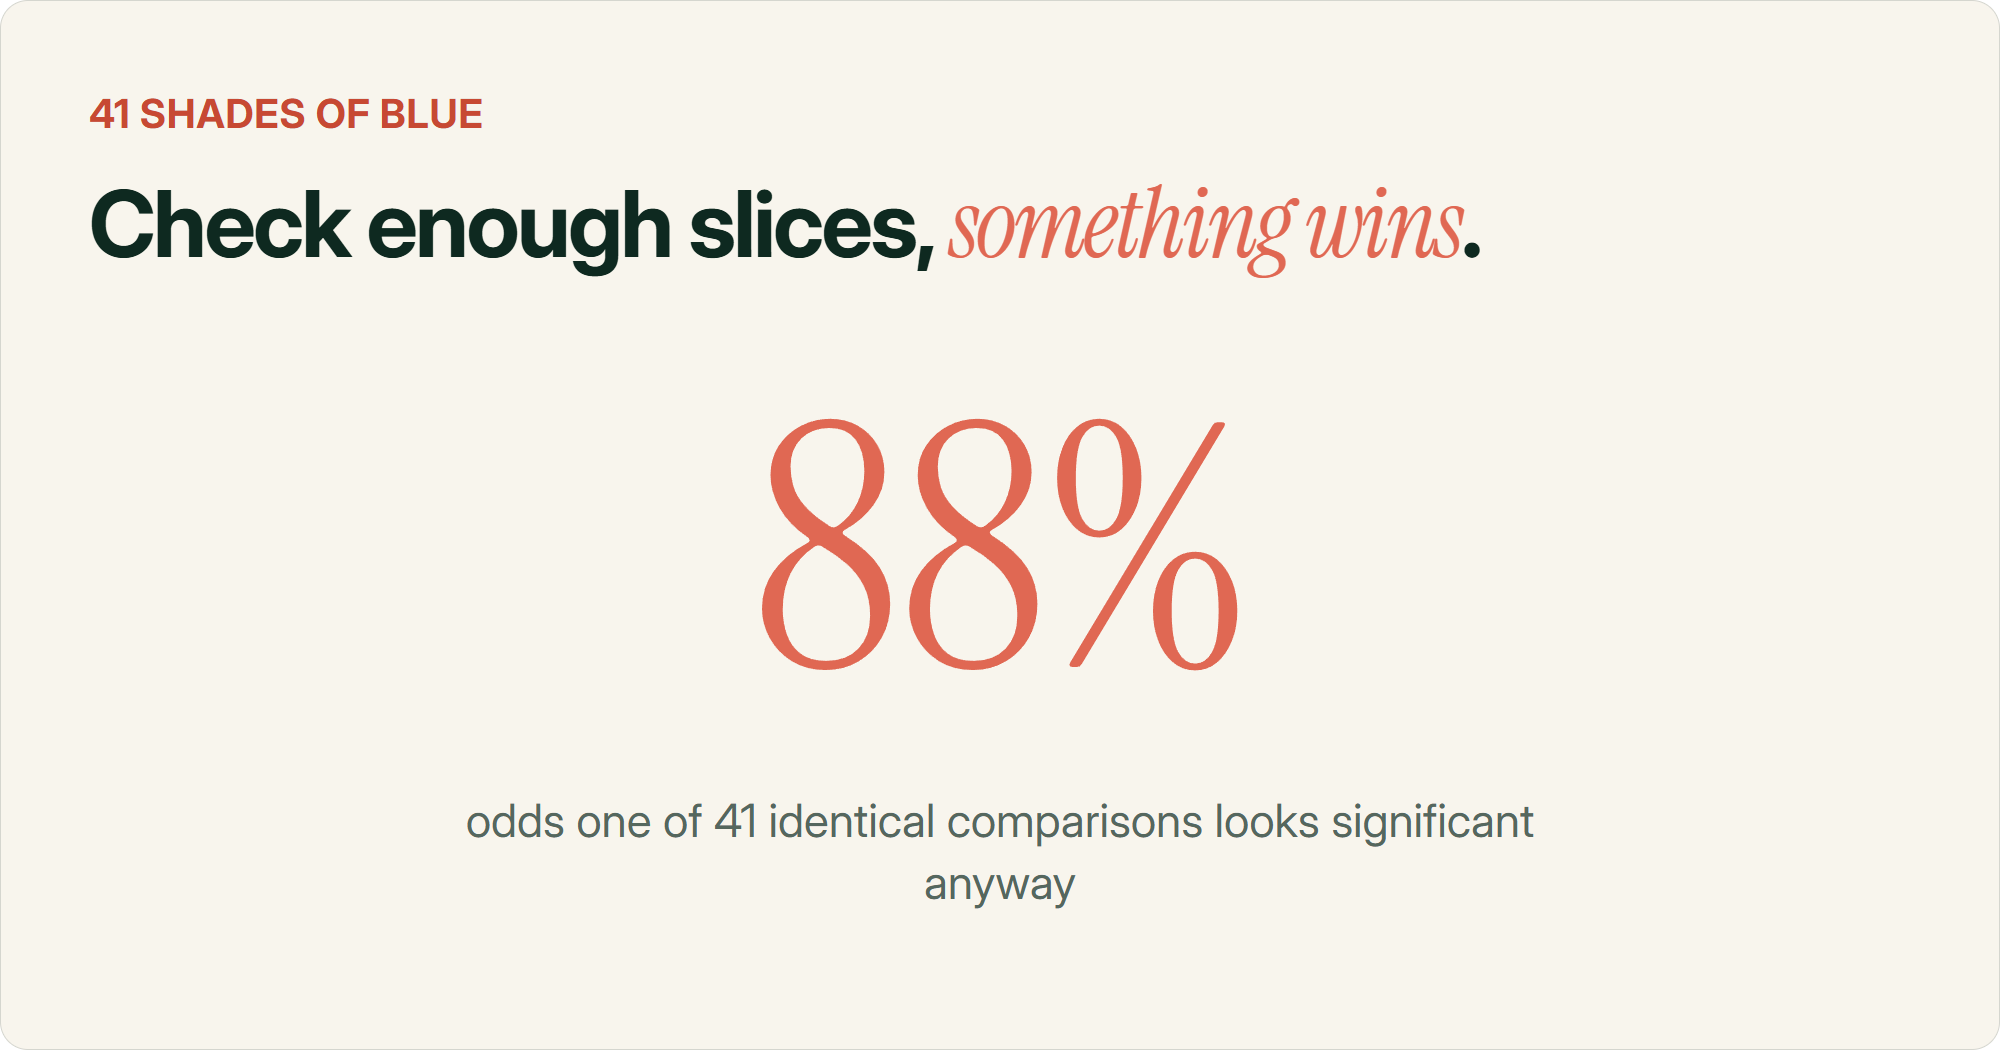
Conversion.com dug up a great real world example of this. Google once tested 41 shades of blue against each other, and that many simultaneous comparisons carried something like an 88% chance that at least one of them would look "significant" even though none of them actually mattered.
There's nothing wrong with looking at segments if you set that up as a hypothesis before the test starts, and you've got the traffic to properly power that segment. What's dodgy is finishing a test, not liking the aggregate result, then fishing through the data until you find a slice that tells you what you wanted to hear.
Set your target lift first Decide what change in conversion rate or revenue actually matters to the business before the test goes live.Calculate the sample size you need Use a calculator or ask an AI tool to work out how many conversions and how many days that target lift requires.Let it run like it's incubating One sanity check a couple of days in is fine. Outside of that, leave it alone until the cutoff.Only judge it at the finish line Evaluate significance once, at the pre-agreed sample size, not the first time the dashboard looks good.
The whole thing comes down to deciding your rules before you start collecting evidence, not after.
Common questions about statistical significance in A/B testing
What is a p-value in an A/B test?
A p-value tells you how surprising your result would be if there was actually no difference between your control and your variant. Under 0.05, the usual cutoff, means there's less than a 5% chance you'd see a result this extreme by pure chance. It's not the probability your variant is better, just a measure of how unlikely the result is under the assumption that nothing changed.
What's the difference between statistical significance and statistical power?
Significance tells you how surprising your result is, assuming there's no real effect underneath it. Power tells you the probability your test will actually detect a real effect if one genuinely exists. You can have a real winner sitting in your data and still miss it if the test was underpowered, meaning too few conversions ran through it to separate signal from noise.
Why did my A/B test look like a winner and then flatten out?
Small samples are noisy. A handful of early conversions on your variant can create a lift that looks dramatic purely by chance, similar to rolling a run of elevens early in a game of dice. As more traffic comes through, that early streak gets diluted by a larger, more representative sample, and the result usually settles closer to the true difference, which is often smaller than it first looked.
How many conversions do I need before I can trust an A/B test?
CXL puts the minimum floor around 250 to 350 conversions per variation, with 3,000 to 4,000 per variation needed before trusting a segment level breakdown inside that result. If your store's conversion rate is low, you need proportionally more visitors and more time to hit those numbers, not just more traffic.
Can I check my A/B test results before it's finished?
You can look, but don't act on what you see. Checking in once or twice for a sanity check, making sure tracking is firing correctly and nothing's broken, is fine. Stopping the test early because the dashboard looks good inflates your real false positive rate well beyond the 5% you think you're working with.
Sources
- How Not To Run an A/B Test, Evan Miller
- Ask a CRO Expert: How Do I Know When My A/B Test is Valid?, Peep Laja, via Unbounce
- A/B Testing for Big Wins: When & How Should It Be Done?, VWO
- Getting A/B Testing Right, CXL
- The top 3 mistakes that make your A/B test results invalid, Conversion.com
- The more the merrier? The problem of multiple comparisons in A/B Testing, Bell Statistics