 Talk to a human
The hockey landing page was redesigned to improve clarity and trust. Learn how these changes impacted conversion rates and user engagement.
Redesigned Hockey Landing Page Focuses on Clarity and Social Proof to Boost Trust
Goal
Conversion rate
Result
-38.5% Conversion rate
Category
—
Outcome
Winner
Before

After

If the hockey landing page is redesigned to emphasize clarity, social proof, and mobile usability, then the conversion rate will increase because users will better understand the product, trust it more, and experience fewer UX blockers when deciding to purchase.
What We Changed
- Redesigned hero section with bold headline and CTA.
- Added "What is the Product?" section early on.
- Prioritized athlete imagery and video content at the top.
- Introduced social proof elements like quotes and endorsements.
- Added FAQs and reviews modules near the page bottom.
The Results
We dig through every data source to map what's actually broken. By the end, there's no confusion.
+1.7%
Click-through rate change
+1.7%
Change in amount of clicks
0.0%
visitors
Key Learnings
- Users found the new design less compelling, affecting conversion negatively.
- Increased focus on visual content didn't translate into higher engagement.
- Early social proof did not sufficiently enhance trust.
- Simplifying UX and building trust requires further refinement.
Detailed results breakdown
Add-to-cart rate change
-21.4%
Average order value
-6.9%
Click-through rate change
+1.7%
Lift in conversion rate
-38.5%
Change in revenue per visitor
-42.7%
Free Trial
Start with 3 experiments.
Zero cost.
Get a taste of our service. We'll analyze your store, pinpoint low-hanging fruit, design, implement and test solutions to lift your conversion rate in 30 days.
Who qualifies?
30,000+ Monthly sessions.
Minimum traffic needed to run statistically significant tests.
Running on Shopify or Shopify Plus.
Our specialty - we don't work with other platforms.
Investing in paid traffic.
We work with stores committed to growth, not hobbyists.
Ready to invest in systematic CRO.
You understand testing takes time - no magic bullets.
Why free?
The best proof is results. Three real experiments show you exactly how we work and whether it drives revenue for your specific store. You keep everything - no strings attached.
Our bet
We're confident enough in our process to invest our time upfront. If the tests work, you'll see the value in continuing at $5,950/month. If not, you got free optimization work.
Limited spots
We take only 4 free trials monthly to maintain quality. Each trial gets our full attention and expertise. If you qualify, secure your spot before this month fills up.
Other experiments we've run
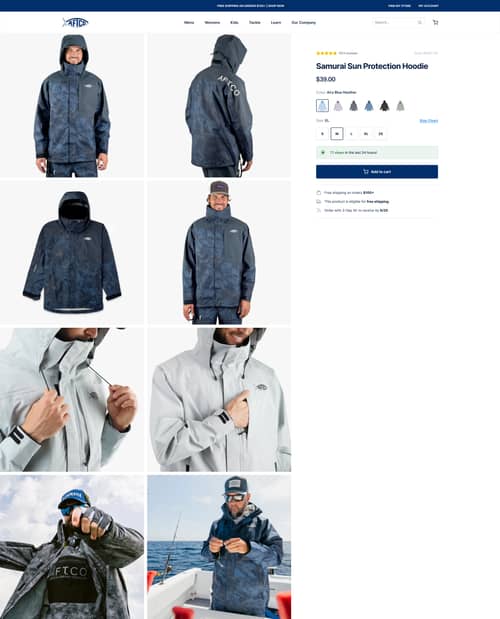
Product Page (PDP)
Winner
Product Image Grid Layout on Desktop PDPs
Switching to a grid layout for product images on desktop PDPs showed improved conversion and add-to-cart rates. Learn how displaying images efficiently can enhance user experience.
+3.0% Add-to-cart rate
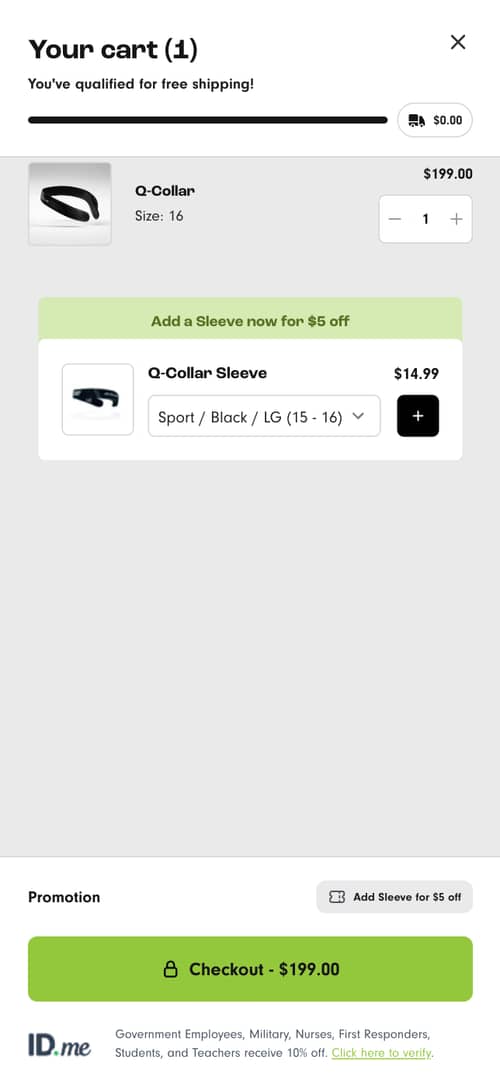
Cart
Winner
Mini-cart redesign with highlighted checkout button boosts conversions and revenue
The minicart was redesigned to improve completion rates by making the checkout button harder to miss. Read the full details of this experiment.
+46.6% Revenue per visitor (RPV)
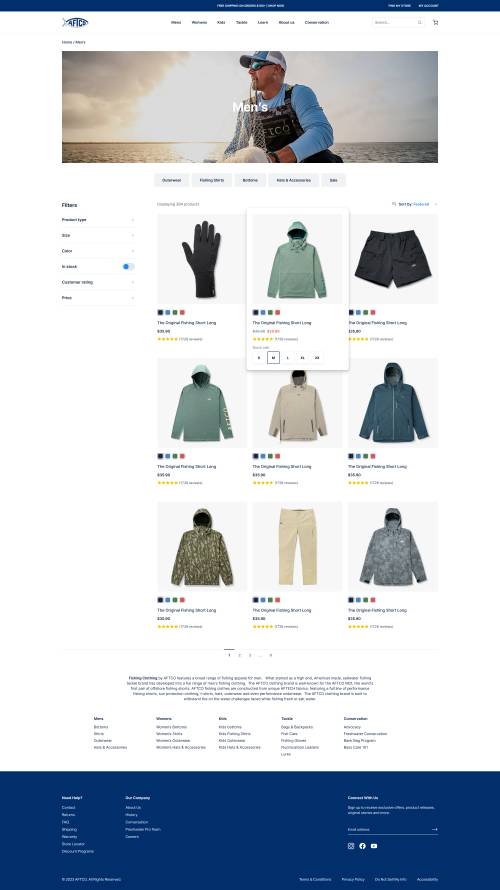
Collection Page (PLP)
Inconclusive
Clickable size buttons on collection pages
Adding clickable size buttons to product cards on desktop streamlined the shopping process, enhancing the add-to-cart rate.
+0.0% Conversion rate