 Talk to a human
Micro-Conversions: How to Judge a Test Without Sales Data

I had a page on a client's store that wasn't allowed to sell anything.
No add to cart button. No pricing. Just science.
The client makes mouthguards designed to protect the brains of athletes who play contact sports, and there's a page on their site that exists purely to explain the research behind the product. It reads more like a science journal than a product page.
I wanted to run a test on it.
The problem is that page barely touches the conversion funnel. Most people who land there don't finish a purchase in the same session, if they finish one at all. So if I'd set conversion rate as the test metric, I'd need months of traffic just to get a result I could trust. And a niche education page doesn't get that kind of volume.
The numbers we did have told an interesting story anyway. People who go through that page are almost three times more likely to buy than people who don't. So we obviously want to keep making the page better. We just needed a way to measure "better" without waiting six months for enough purchases to stack up.
That's the actual use case for micro-conversions. A real mechanism for testing pages that don't sell directly, not a definition you look up once and forget.
What a micro-conversion actually is
A micro-conversion is a smaller action a visitor takes on the way to (or alongside) the thing you actually care about, the macro-conversion. For most stores that's a completed purchase.
I've written before about the funnel side of this, where micro-conversions split into process milestones (add to cart, begin checkout, steps that sit directly on the path to a sale) and secondary actions (newsletter signups, wishlist adds, things correlated with a future sale but not required for this one).
That framework is useful for fixing a leaky funnel. It's not quite enough for what I'm talking about here.
The education page sits in a weirder spot than either category. Nobody has to read it to buy a mouthguard, so it's already outside the direct path. And unlike a wishlist add, it isn't really pulling someone toward a future purchase either. It works more like a trust signal, sitting off to the side of the funnel entirely, quietly doing its job on people who happen to stumble onto it.
So the definition needs to stretch a bit. A good micro-conversion is any faster-arriving signal that predicts your real outcome well enough to test against, whatever that outcome is.
That "whatever the outcome is" part matters. If you're trying to move lifetime value, you're not going to measure that directly either. Lifetime value plays out over three, six, twelve months. You can't wait that long to know if a change worked. So you'd probably lean on email open rate, or how often someone comes back and does something small on the store, as your proxy instead.
Micro and macro actions don't move in lockstep. There's rarely a clean one to one relationship. But you can usually read the trend, especially if you stack a few micro-conversions together instead of trusting just one.
What makes a micro-conversion actually good
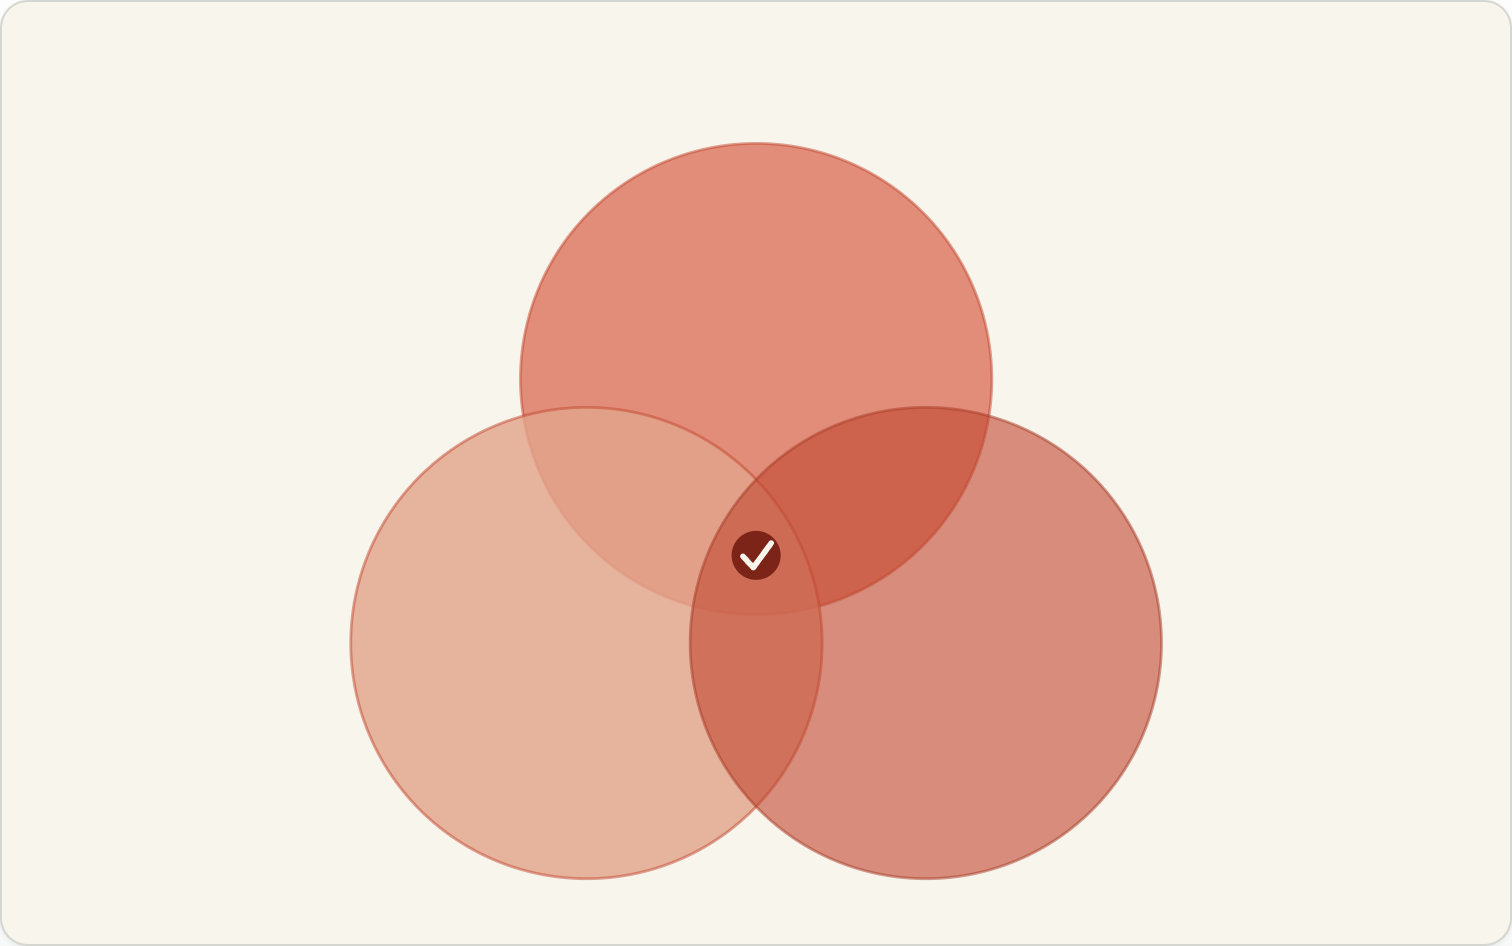
Not every event on a page qualifies. You can't just grab any click and call it a proxy metric. There are really three things that separate a good micro-conversion from a noisy one.
How correlated it is with the real outcome
This is the first one, and it's the most intuitive. When the micro-conversion moves, does the macro-conversion move with it, and by roughly how much?
Say your add to cart rate goes up 10%. Does your actual conversion rate follow it up by something like 5%? If yes, you've got a metric worth trusting. If the two barely track each other, you've got a metric that looks useful and isn't.
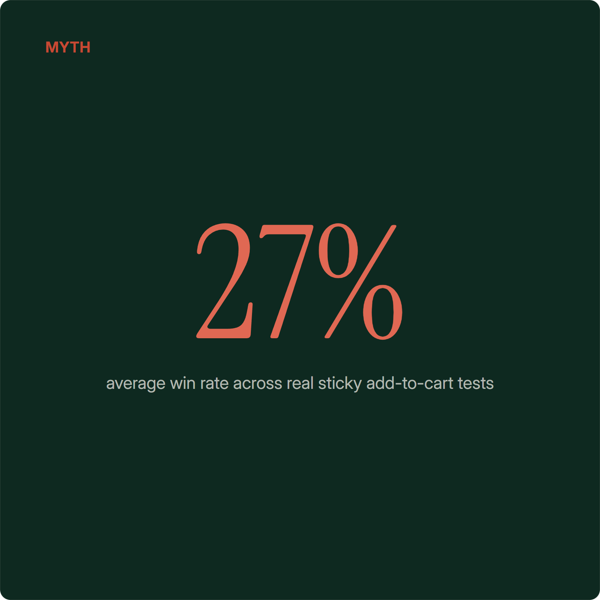
GoodUI actually ran the numbers on this across their own test archive, and it's a good gut check for anyone assuming add to cart is automatically a safe proxy.
0.50 Correlation between add to cart rate and sales, across 44 tests0.61 Correlation between checkout-visit rate and sales, across 533 tests
Add to cart is only a moderate proxy for revenue. Checkout-visit rate, being closer to the actual sale, tracks a lot more tightly. Neither one is perfect, and that's kind of the point. You want the best proxy metric available for the specific page you're testing, not just the easiest one to pull from your dashboard.
I still default to add to cart a lot of the time, mostly because the volume is there and it's already sitting in every dashboard. But I've stopped treating a win on it as the same thing as a revenue win. Those two things can point in opposite directions, and it's cost me a false positive or two before I learned to check.
Common mistake
An 8% add to cart rate can be losing money while a 3% add to cart rate is printing cash, because add to cart only measures intent, not revenue. Don't treat an add to cart lift as a revenue-equivalent win on its own.
Sensitivity, or whether it actually moves
This one's a bit more academic and it took me a while to properly get my head around it. It comes from the same place as statistical power (I went deep on power and sample size in the low-traffic testing article, so I won't repeat it all here).
Sensitivity is the likelihood that your micro-conversion actually moves, given that a real effect exists. It's not asking "is this metric correlated with revenue." It's asking "if I genuinely make the page better, will this specific metric even register it."
Take add to cart again. Imagine a change that makes people more confident to complete a purchase they'd already started, rather than more likely to start one in the first place. Add to cart could stay completely flat in that scenario, even though the change worked. Low sensitivity, real effect, invisible metric.
Now imagine a change that gets more people into the funnel in the first place. Add to cart goes up, and because you've fed more people in at the top, your downstream conversion rate should follow eventually too. High sensitivity, and it's a metric that'll actually tell you something.
Same event, two completely different sensitivity profiles depending on what the change is actually doing. Which is annoying, but it's why you can't just pick a proxy once and reuse it forever.
Causal proximity, or how much noise sits between the two
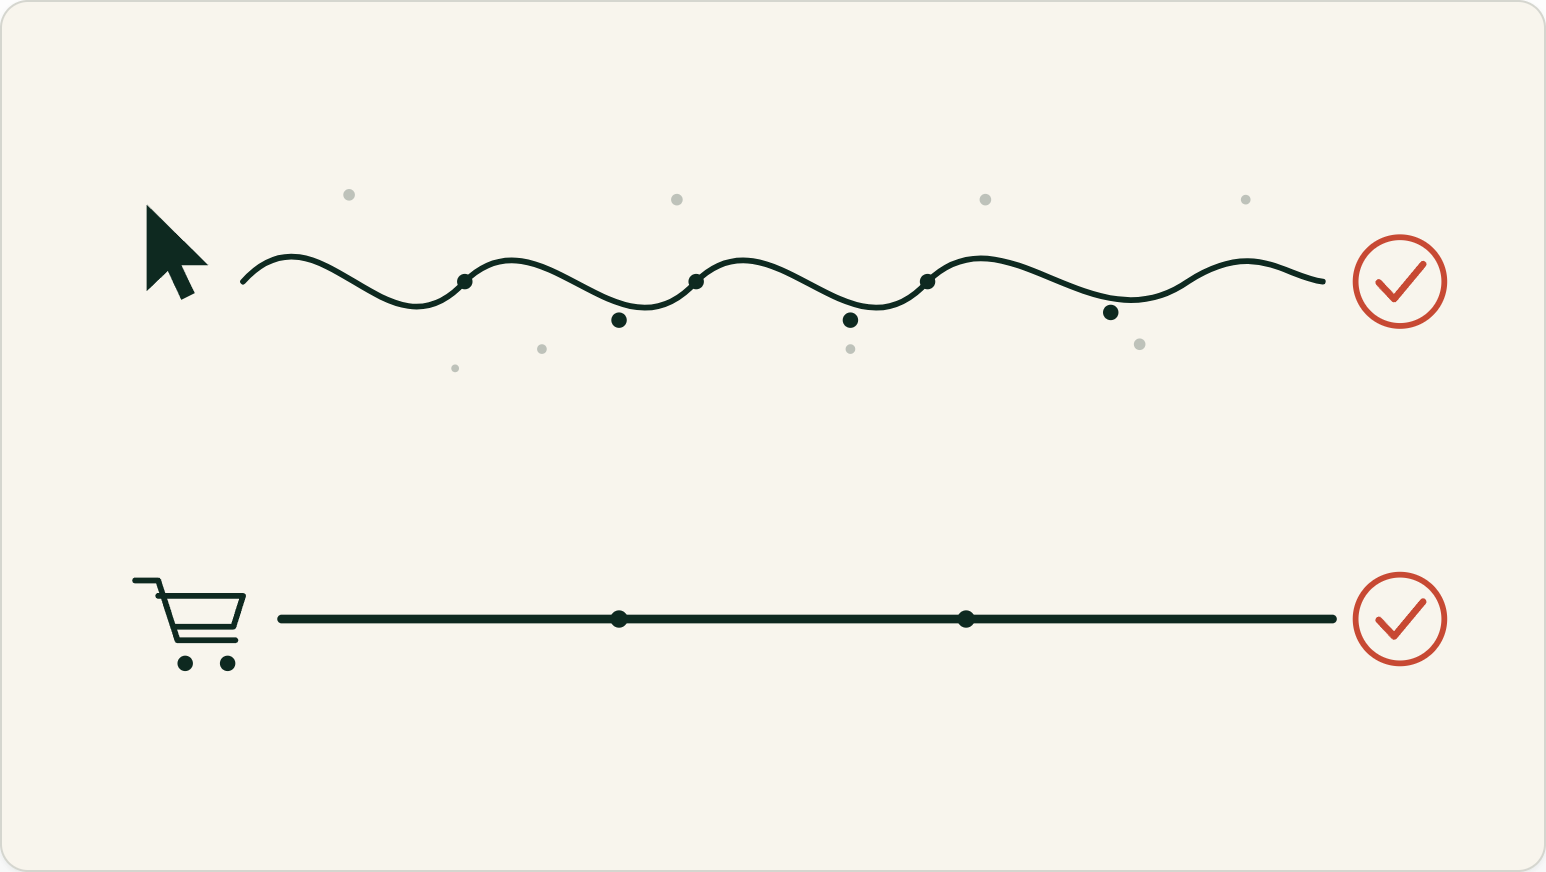
The last piece is how close the micro-conversion sits to the actual sale, and how much room there is for noise to creep in between them.
Hero button click Far from the sale
- Click through to a collection or PDP
- Assess the product, maybe check reviews
- Add to cart
- Get to the cart page
- Complete checkout
Begin checkout Close to the sale
- Fill in the checkout fields
- Complete the purchase
A hero button click has five or six real decision points sitting between it and a completed sale. All of that is room for something unrelated to your test to interfere. Begin checkout has basically one step left. Less room for noise, tighter read.
This is why the same category of event, a click, can be a great proxy or a useless one depending entirely on where it sits in the journey.
Why the right proxy is a speed problem, not just an accuracy one
This next part changes how you run a testing program day to day, not just how you read one test result.
Every store only has so many conversions to go around, and every experiment you run soaks up a share of them. I've written before about running tests in parallel and what I call terminal testing velocity, basically running as many experiments as your traffic can support without them stepping on each other. The bottleneck in almost every case isn't ideas. It's conversion volume.
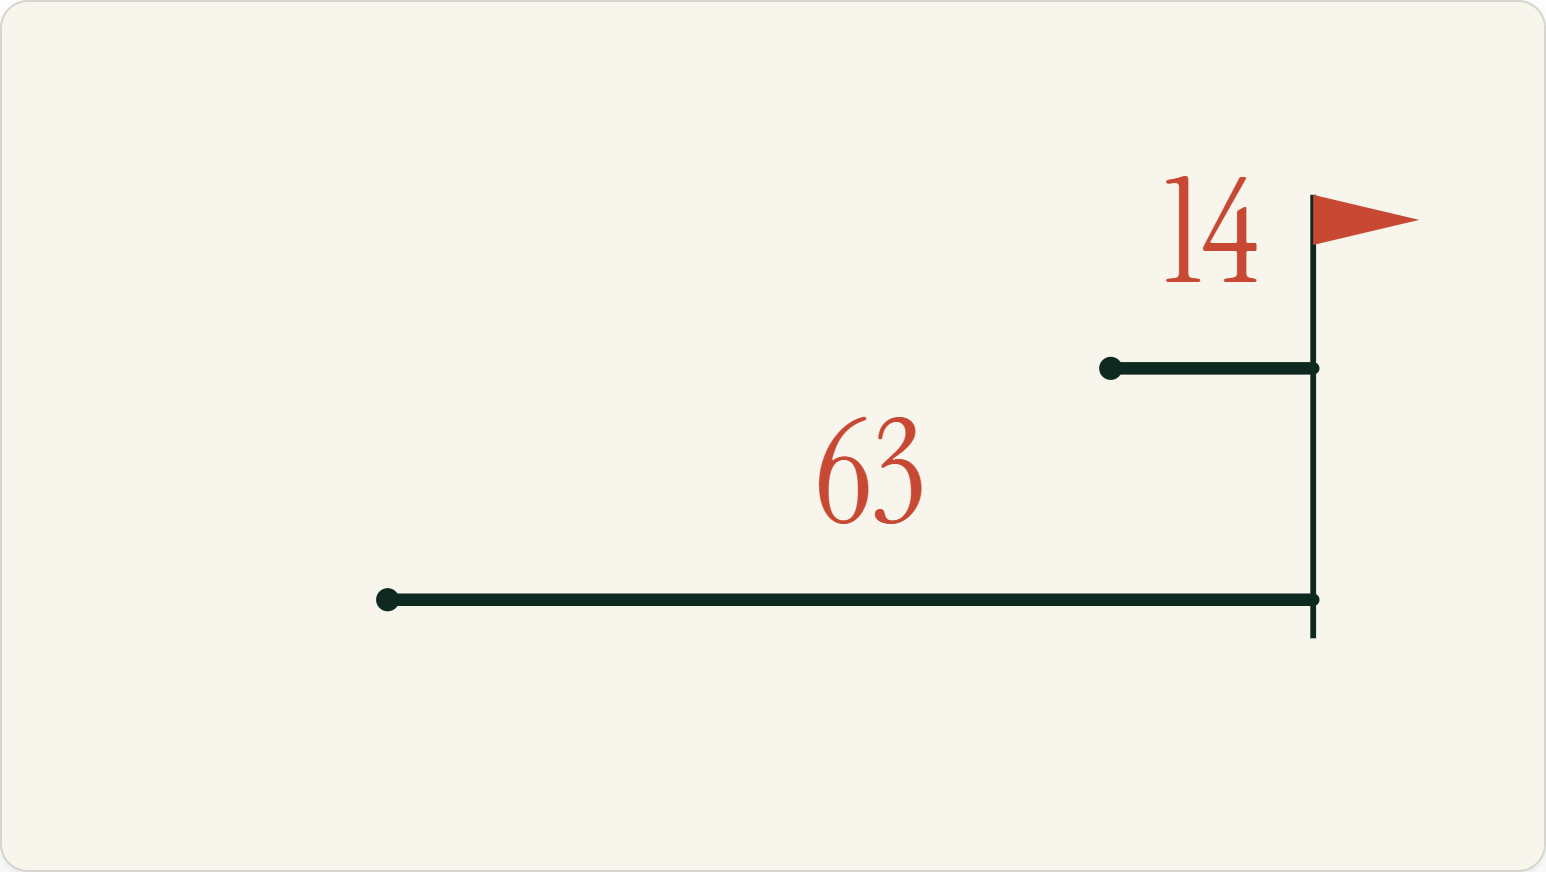
4-5x How much longer it takes to reach the same decision confidence waiting on full purchase data instead of a validated proxy metric, based on Netflix's own experimentation research
Netflix ran this exact comparison across 200 real tests. A 14-day proxy signal matched the decision you'd get from waiting the full 63 days for ground truth about 95% of the time. So waiting the long way isn't just slower, it's giving up most of your testing velocity for a fairly small gain in certainty.
For anyone running a performance-based testing program, that tradeoff matters a lot. We want to run as many experiments as we can and know as early as reasonably possible whether something is working or going flat, so we can decide whether to leave it running or move on to the next idea.
How I actually use this on live tests
To be clear, this isn't about calling tests early off a shaky first-week read. That's a different mistake entirely, and I've seen enough conflicting add to cart versus revenue results to know better than to trust a directional squint.
What it actually looks like in practice:
Pick the closest reliable proxy Not the easiest metric to pull, the one closest to the actual sale for that specific page and that specific change.Watch it alongside the real metric The macro conversion rate keeps running in the background the whole time, even while it's still too thin to read on its own.Let the proxy reach its own significance Once the proxy metric clears the bar on its own terms, and the downstream numbers aren't trending the wrong way, I treat that as the signal to leave it live.Move on to the next experiment Testing budget is finite. Once a test has ticked the box, keeping it running just to double check eats into the next idea's runway.
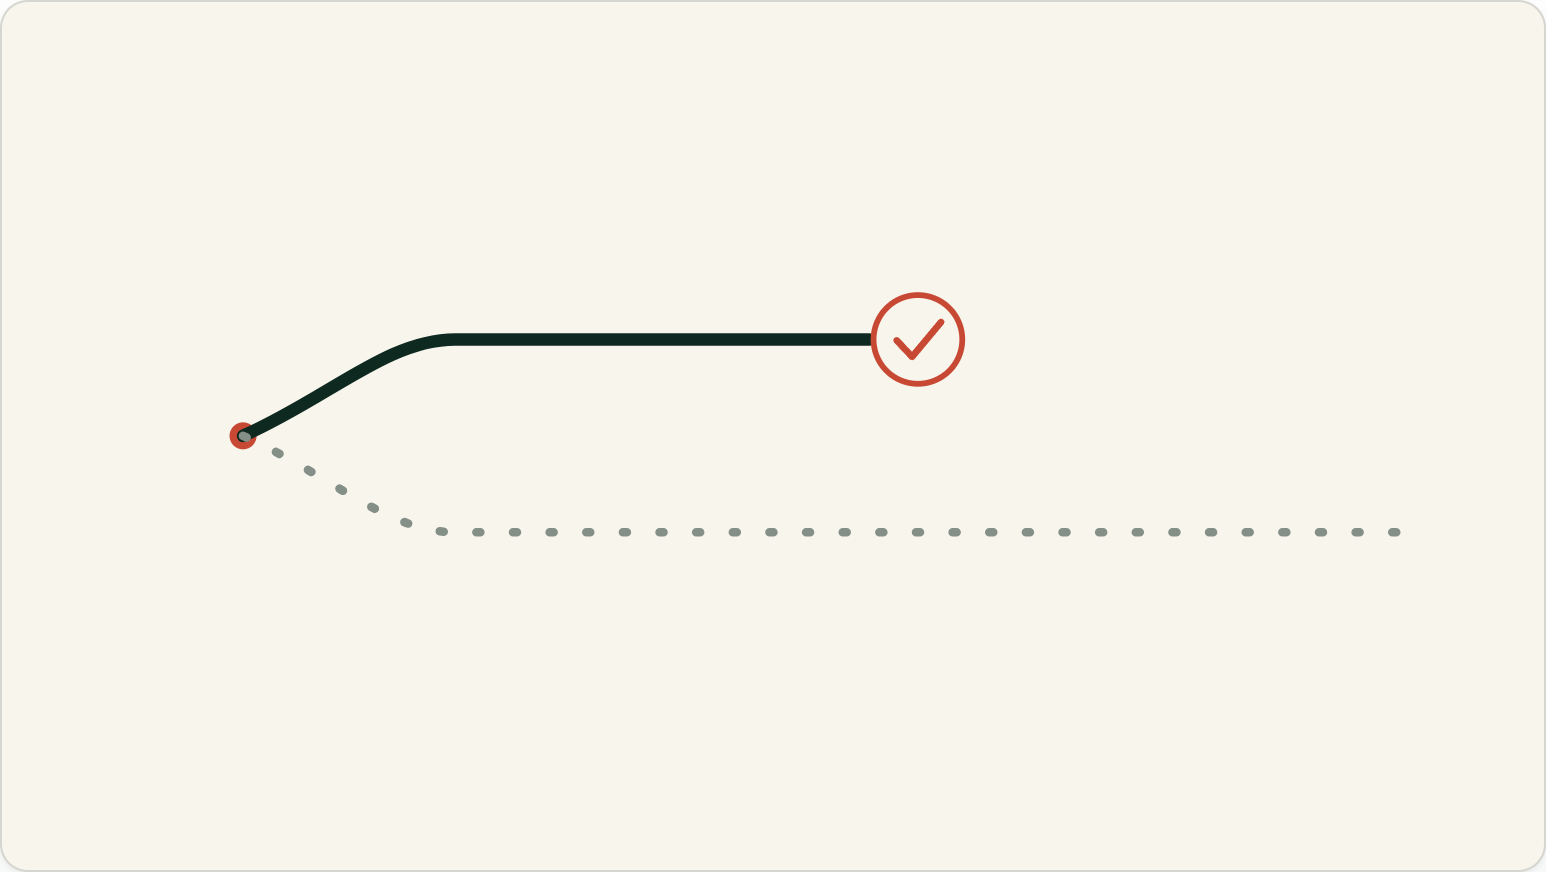
For the mouthguard education page, that meant using scroll depth into the research section and time spent on page as the proxy, since there was no add to cart to lean on at all. Not perfect metrics on their own, but close enough to what mattered and with enough volume to actually reach significance in a reasonable window.
The downstream purchase number still moves eventually. It just moves on its own schedule, and I don't need to sit around waiting for it before I know whether the page is working better than it did before.
Common questions about micro-conversions in A/B testing
What's the difference between a micro-conversion and a macro-conversion?
A macro-conversion is the outcome you actually care about, usually a completed purchase. A micro-conversion is a smaller, faster-arriving action that predicts it, like add to cart, begin checkout or scroll depth on a research-heavy page. You use micro-conversions when the macro-conversion is too rare or too slow to test against directly.
Is add to cart rate always a safe metric to test on?
No. GoodUI's own test archive found only a moderate correlation (around 0.50) between add to cart rate and actual sales. It's a decent early signal but it can move for reasons that have nothing to do with revenue, like a bigger button or urgency copy. Pair it with a metric closer to the sale where you can.
Can I combine more than one micro-conversion in a single test?
Yes, and it's usually more reliable than trusting one alone. Stacking a few micro-conversions, weighted toward the ones with better sensitivity and correlation, gives you a stronger directional read than any single metric on its own, especially on pages with several plausible proxies.
Is calling a test early off a micro-conversion the same as testing on a proxy metric?
No, and mixing the two up is where most of the mistakes happen. Testing on a proxy metric means picking a faster, well-correlated signal and running it to its own statistical significance. Calling a test early means acting on a shaky directional read before anything has actually reached significance. The first is a deliberate design choice. The second is guessing.
What proxy metric should I use for a page that isn't part of the funnel, like an education or content page?
Look for the closest behavioral signal to genuine engagement with the content itself, things like scroll depth into the key section, time on page or return visits. There's no add to cart equivalent for a page like this, so you're relying more heavily on causal proximity and sensitivity than on a clean correlation number, since you likely won't have one.
Sources
- Do Adds-To-Cart Or Progression Metrics Correlate With Sales In A/B Tests? — GoodUI, Jakub Linowski
- Improve Your Next Experiment by Learning Better Proxy Metrics From Past Experiments — Netflix Technology Blog
- Evaluating the Surrogate Index as a Decision-Making Tool Using 200 A/B Tests at Netflix — Netflix, arXiv
- Beyond Power Analysis: Metric Sensitivity Analysis in A/B Tests — Microsoft Experimentation Platform
- Should You Optimize for Micro Conversions? — CXL