A/B Experiments
See the Tests That Generated $7.3M+ in Revenue
Explore real A/B tests and conversion experiments run for Shopify stores across multiple industries. Every test shown here includes actual data, implementation details, and measurable outcomes—no theoretical advice, just proven results.
Search & Navigation
Inconclusive
Enhanced Search Interface
The search experience was revamped to include suggestions and previews, aiming to boost engagement and conversions. Discover the results of this intuitive redesign.
-12.0% Conversion rate
Other
Winner
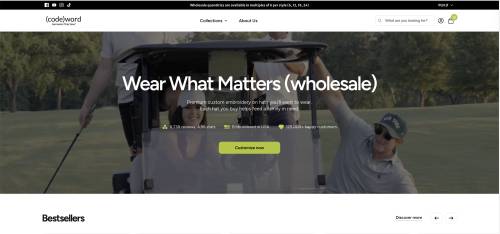
Sitewide button color update from yellow to green
+1.8% Clickthrough rate
Homepage
Inconclusive
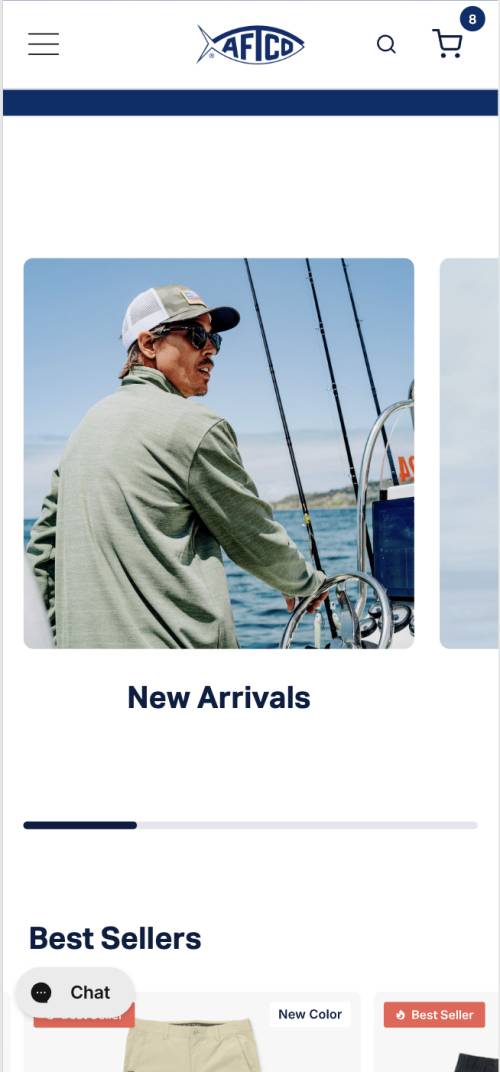
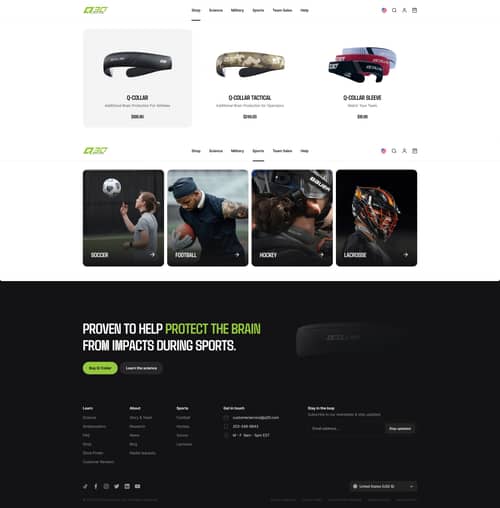
Homepage category slider with lifestyle images
Adding large, image-driven tiles for key categories under the hero section aimed to boost engagement. Discover how this change impacted user interactions.
+2.3% Clickthrough rate

Landing Page
Inconclusive
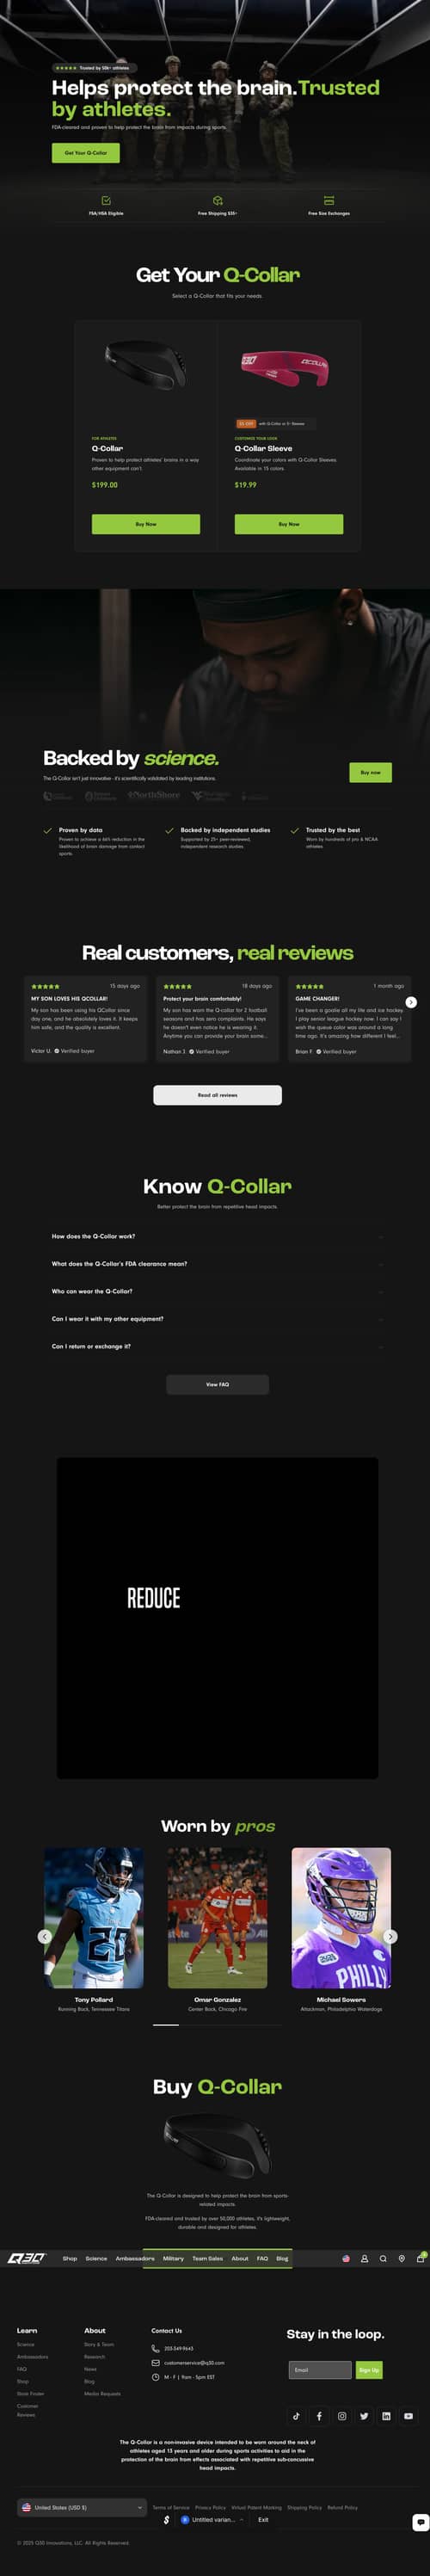
Educational advertorial landing page boosts parent engagement and conversions
We tested an advertorial-style landing page to see if storytelling and educational content increase conversions from social traffic. Discover the impact of this approach on engagement and sales.
+2.3% Conversion rate
Homepage
Winner
Personalized homepage layout for returning visitors
Personalizing the homepage for returning visitors increased conversion rates and reduced bounce rates. Discover how these changes improved user engagement.
+39.3% Conversion rate
Product Page (PDP)
Inconclusive
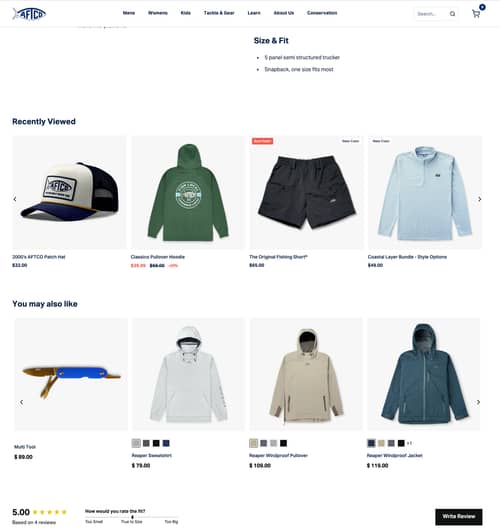
Recently Viewed Products Section
A new "Recently Viewed" products section was added for returning visitors. Learn how this change impacted user engagement and conversion.
+1.0% Conversion rate
Product Page (PDP)
Winner
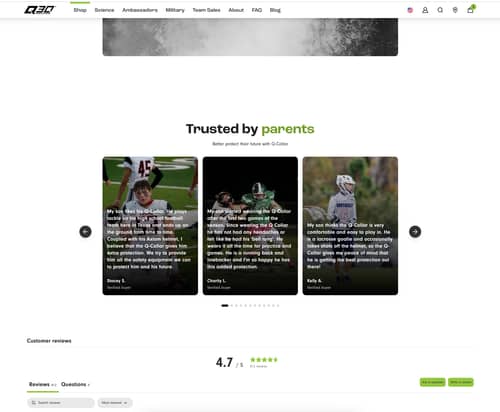
Enhanced Parent and Kid Testimonials Boost Trust
We added user-generated content with parent testimonials to the product pages. Here’s how those updates moved the needle on key metrics.
+15.0% Revenue per visitor (RPV)
Search & Navigation
Winner
Website footer and header redesign
We revamped the website footer to improve navigation and declutter the main menu. Learn how this change impacted key performance metrics.
-16.3% Conversion rate
Collection Page (PLP)
Winner
Dynamic filtering system
Introducing a dynamic filter system improved user experience by allowing customers to refine product searches efficiently. Discover how these changes impacted key conversion metrics.
+10.1% Conversion rate
Product Page (PDP)
Inconclusive
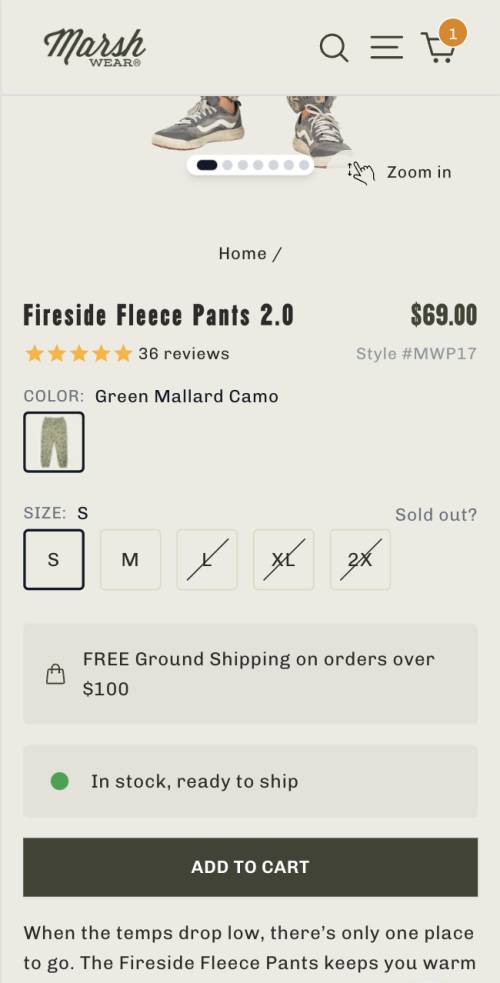
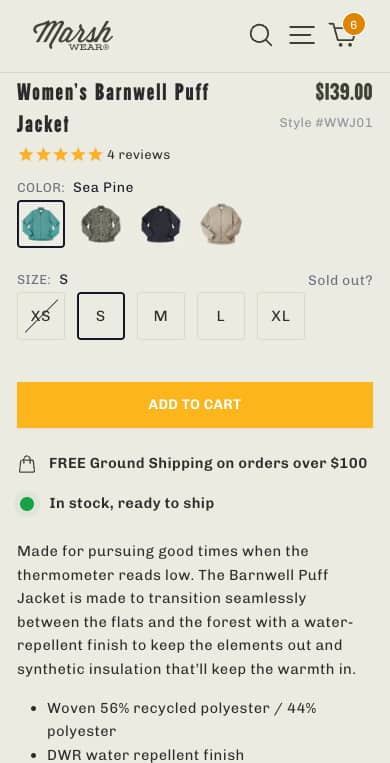
Moving Free Shipping Message Below Add to Cart
Adding a free shipping note under the Add to Cart button aimed to boost conversions by reducing purchase hesitation. See how this simple change impacted key metrics.
-0.2% Conversion rate
Product Page (PDP)
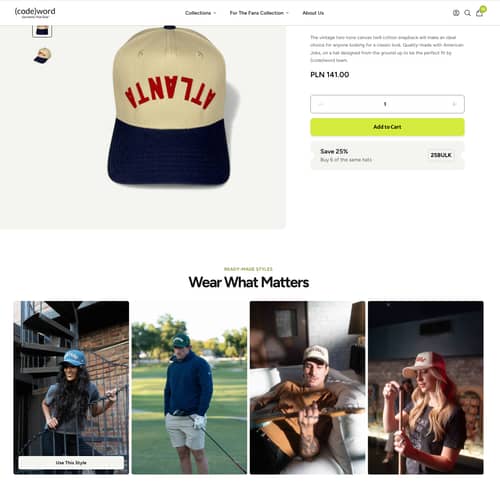
Winner
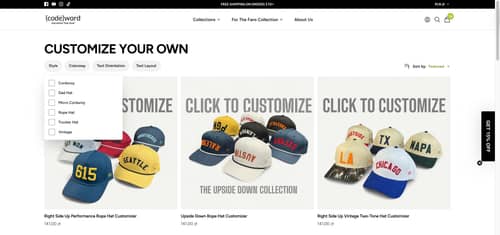
Inspiration Gallery on Custom PDP
Discover how adding a gallery of ready-made hat designs increased engagement and conversions by helping customers visualize customization options.
+6.3% Conversion rate
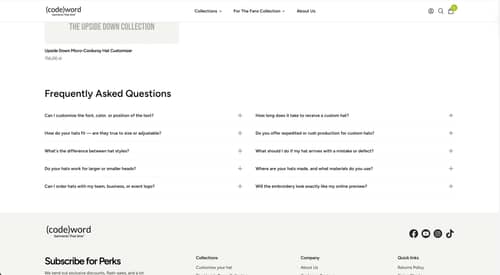
Collection Page (PLP)
Winner
Customer review-inspired FAQs on collection pages
Displaying FAQs at the bottom of collection pages increased conversion rates and reduced bounce rates. Read the full writeup.
+8.4% Conversion rate