A/B Experiments
See the Tests That Generated $7.3M+ in Revenue
Explore real A/B tests and conversion experiments run for Shopify stores across multiple industries. Every test shown here includes actual data, implementation details, and measurable outcomes—no theoretical advice, just proven results.
Product Page (PDP)
Winner
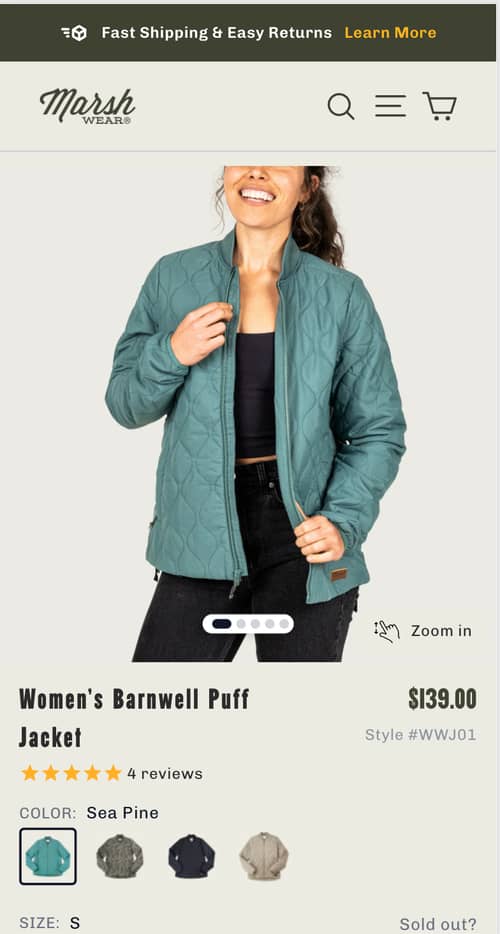
Modern Carousel Controls Boost Product Engagement and Conversion Rates
The product image carousel was redesigned to improve user engagement and streamline the shopping experience. Learn how these changes impacted conversions and revenue.
-0.5% Add-to-cart rate
Product Page (PDP)
Winner
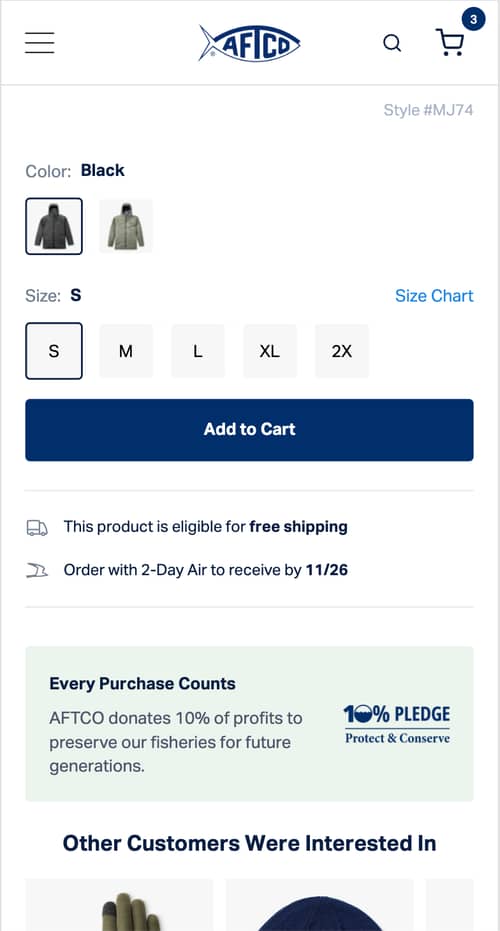
Refined Free Shipping Message on PDP
Displaying a dynamic free shipping message on the PDP improved the conversion rate by 7.1%. Check out the full breakdown of this test.
+7.1% Conversion rate
Cart
Inconclusive
Trust-building icons boost checkout confidence and conversions
Adding trust-building icons to the checkout page increased customer confidence and reduced purchase hesitation. Learn how these changes impacted key metrics.
+0.9% Conversion rate
Banner
Inconclusive
Shipping Info Banner Breaks Down Objections Around Shipping
A shipping info banner was added to the site to break down the objections around shipping costs and delivery times. Check out how this experiment went.
+1.5% Conversion rate
Collection Page (PLP)
Loss Prevented
Add-to-Cart Button on Mobile Collection Pages To Boost Purchase Convenience
We tested adding an "Add to Cart" button on mobile collection pages to simplify the purchase process. Discover how this change impacted key performance metrics.
-2.7% Add-to-cart rate
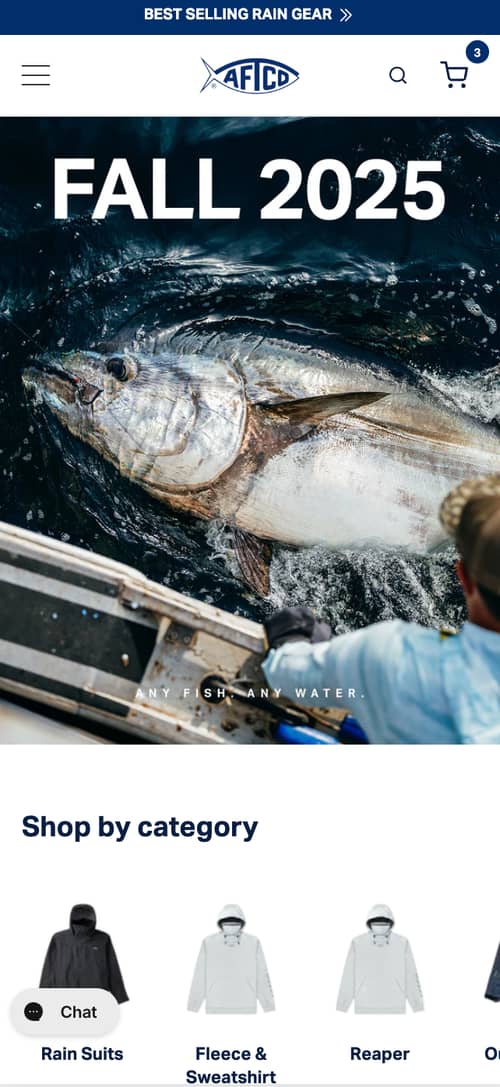
Homepage
Inconclusive
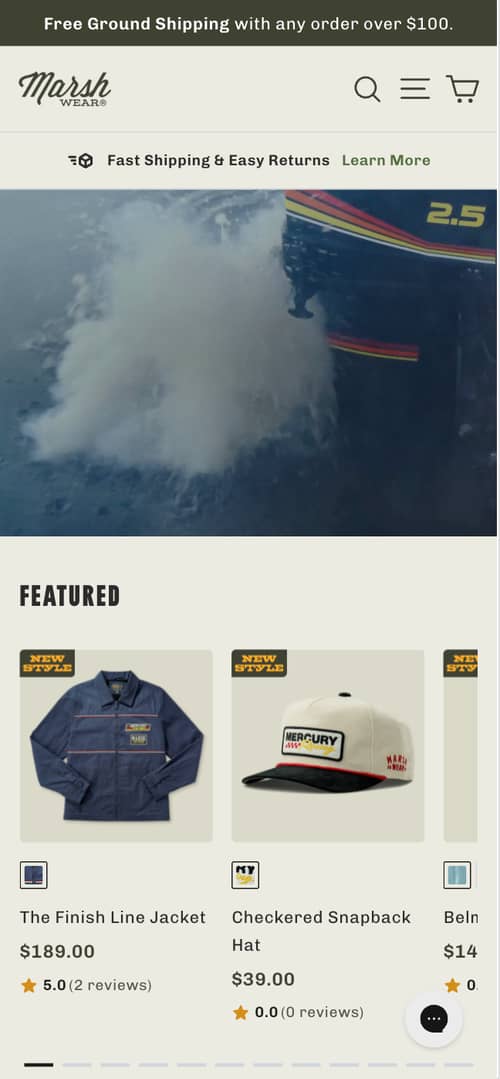
Relocating 'Shop by Category' Below the Hero to Boost Visibility and User Engagement
The "Shop by Category" section was moved beneath the homepage hero to boost visibility and early engagement. Discover the impact on user behavior and conversions.
-0.1% Clickthrough rate
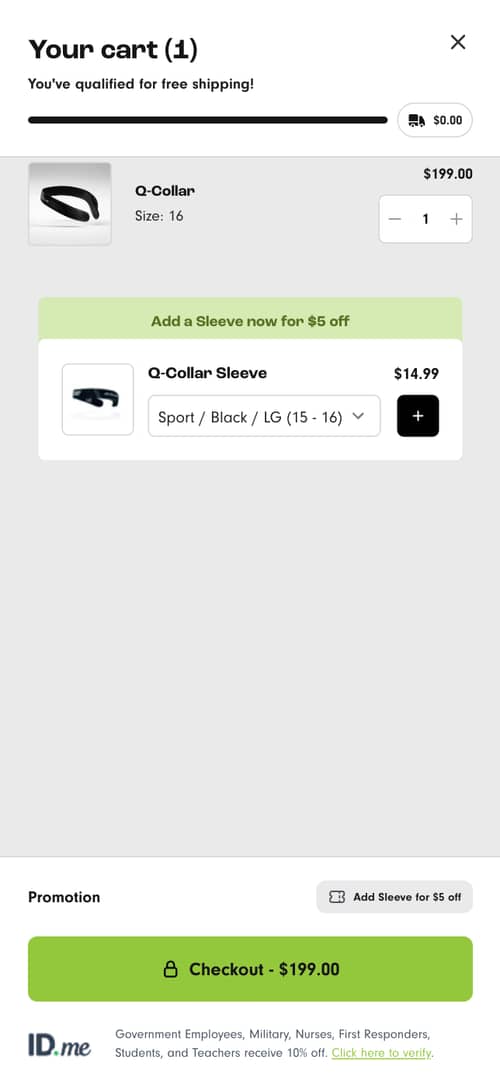
Cart
Winner
Mini-cart redesign with highlighted checkout button boosts conversions and revenue
The minicart was redesigned to improve completion rates by making the checkout button harder to miss. Read the full details of this experiment.
+46.6% Revenue per visitor (RPV)
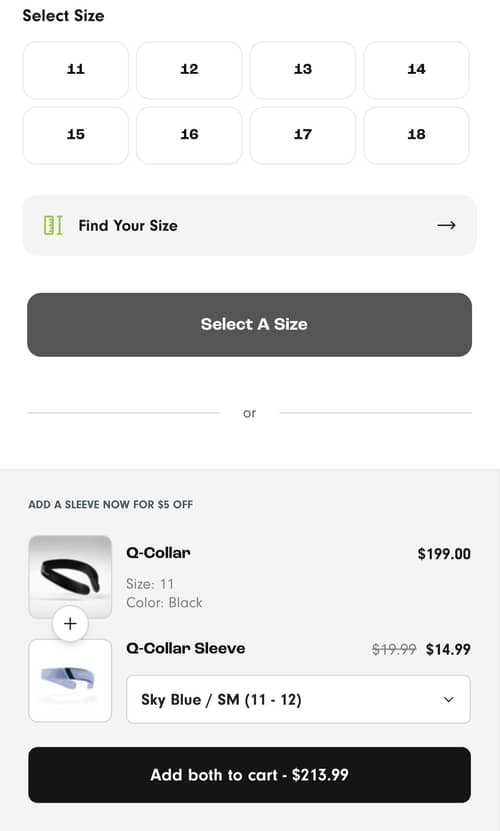
Product Page (PDP)
Winner
Boosting AOV with Collar and Sleeve Bundle Promotion on PDP
Adding a bundle promotion near the Add to Cart button aimed to boost average order value. See how this change impacted customer behavior and sales.
+0.6% Revenue per visitor (RPV)
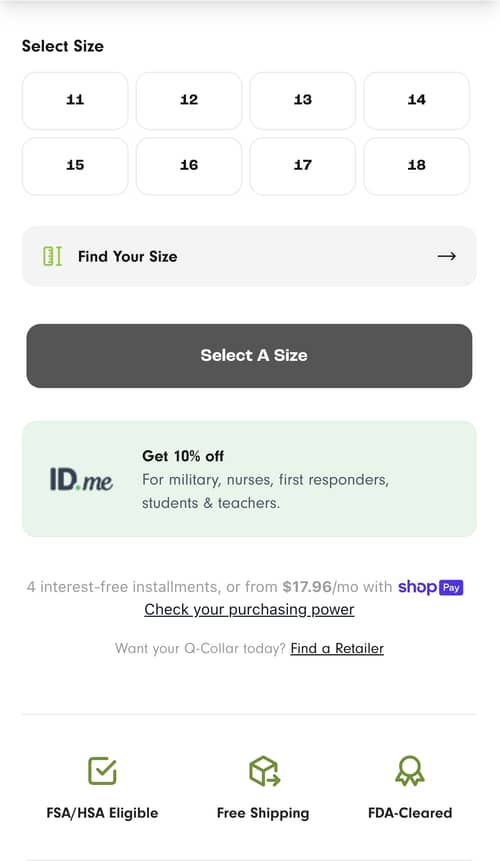
Product Page (PDP)
Winner
Prominent Discount Messaging Boosts Conversions and Revenue Across Devices
Highlighting a 10% discount for specific groups led to significant increases in mobile conversions and engagement. Discover how this strategy influenced user behavior.
+1.2% Conversion rate
Product Page (PDP)
Inconclusive
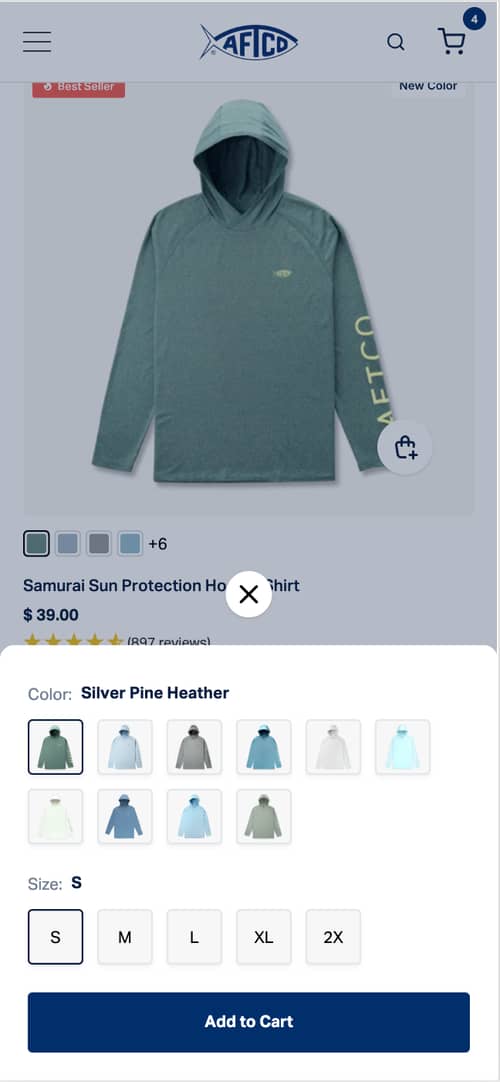
Transforming the Sticky Add to Cart into a Persistent Bottom Bar
A test was conducted to transform the sticky image on product pages into a sticky Add to Cart bar. Discover the impact on conversion rates and user interaction.
+3.7% Conversion rate
Product Page (PDP)
Loss Prevented
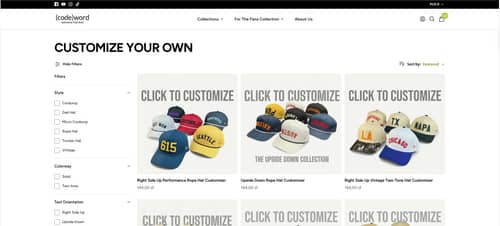
Enhanced Collection Filtering by Hat Attributes
Introducing a dynamic filter system on collection pages aimed to enhance user experience by enabling easier product discovery. Learn how this change impacted key performance metrics.
-6.4% Conversion rate

Homepage
Winner
Directing Ads Traffic to the Homepage Boosts Conversions and Revenue
The test redirected traffic from Hockey ads to either the homepage or the optimized Hockey Landing Page to evaluate the impact on conversion and engagement.
+83.5% Add-to-cart rate