 Talk to a human
A/B Experiments
See the Tests That Generated $7.3M+ in Revenue
Explore real A/B tests and conversion experiments run for Shopify stores across multiple industries. Every test shown here includes actual data, implementation details, and measurable outcomes—no theoretical advice, just proven results.
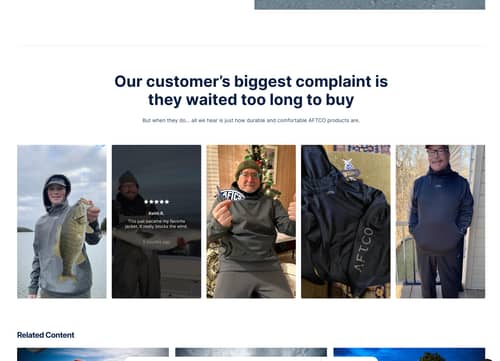
Product Page (PDP)
Winner
Enhanced Desktop Experience
The desktop experience was enhanced with improved navigation and visuals. See how add-to-cart rate lifted 7.1% and bounce rate dropped 4.7%.
+1.81% (ACR) ACR

Product Page (PDP)
Inconclusive
Desktop Conversion Rate Optimization
Desktop-focused optimizations produced a 3.8% conversion rate lift and 2.6% more orders, with a slight AOV decline.
+1.74% (CVR) CVR
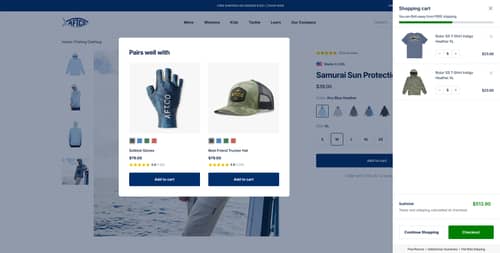
Product Page (PDP)
Inconclusive
Updated Desktop Experience
Desktop interface updates resulted in a 2.8% conversion decline and 5.6% RPV drop. See why the changes didn't resonate with users.
-2.88% (AOV) AOV

Product Page (PDP)
Winner
Streamlined Product Page for Conversion
Streamlining the product page drove a 10.4% conversion rate lift and 6.1% more orders, but AOV dropped 11.9% and revenue declined.
+10.41% (CVR) CVR
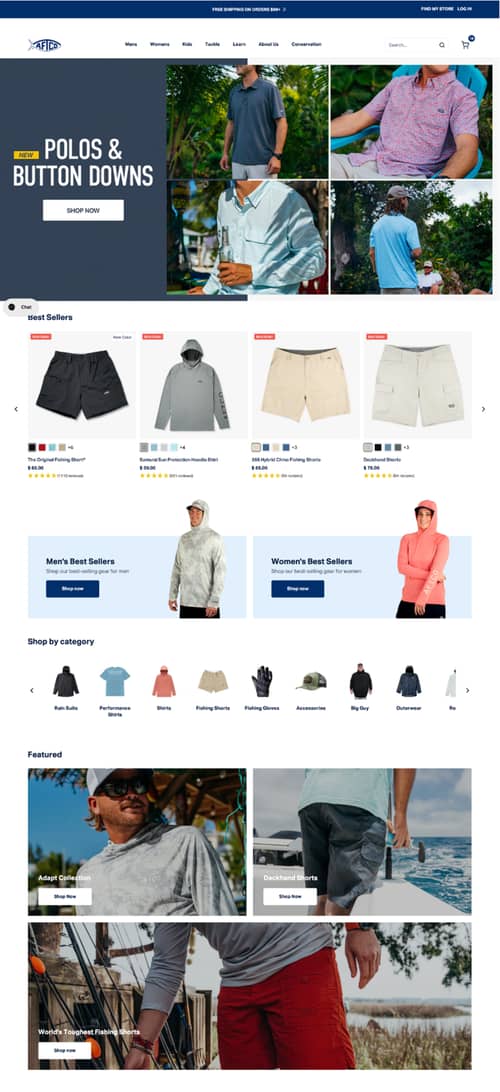
Cart
Inconclusive
Simplified Checkout Process
The checkout process was simplified with fewer steps and cleaner forms. See how these changes impacted conversion rate and bounce rate.
+0.5% Clickthrough rate

Product Page (PDP)
Winner
PDP Updates Drive a 17.9% Increase in Cart Additions
Updates to the product page layout and cart button visibility led to increased user engagement and purchases. Discover the key improvements and their impact.
+17.80% (ACR) ACR
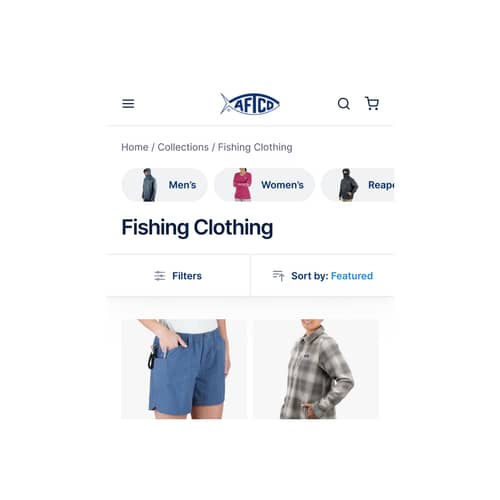
Product Page (PDP)
Winner
Mobile Site Optimization
Mobile site optimization drove a 5.1% conversion rate lift and 7.9% RPV increase. Learn how performance and navigation improvements translated to more orders.
-3.79% (CVR) CVR

Product Page (PDP)
Inconclusive
Simplified Product Page Layout
Simplifying the product page layout lifted AOV by 4.4% but had minimal impact on conversion rate and revenue per visitor.
-0.92% (AOV) AOV

Product Page (PDP)
Winner
Mobile Experience Optimization
Optimizing the mobile experience drove a 4.7% conversion rate lift, 5.9% more orders, and 5.79% revenue increase.
+4.69% (CVR) CVR
Product Page (PDP)
Winner
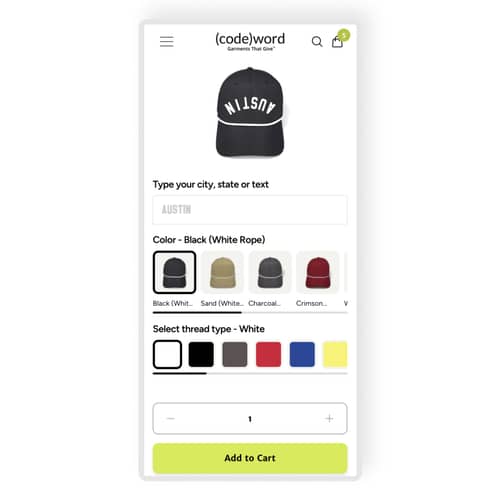
Input-First Mobile Customizer
The mobile customizer was redesigned with an input-first approach and placeholder guidance. See how conversion rate increased 4.5% and bounce rate dropped 9.1%.
+2.8% Conversion rate

Product Page (PDP)
Winner
Updated Product Page Design on Desktop
The desktop product page was redesigned to improve navigation and engagement. See how the updated design lifted conversion rate by 8.5% and RPV by 17.6%.
-1.40% (CVR) CVR