A/B Experiments
See the Tests That Generated $7.3M+ in Revenue
Explore real A/B tests and conversion experiments run for Shopify stores across multiple industries. Every test shown here includes actual data, implementation details, and measurable outcomes—no theoretical advice, just proven results.
Product Page (PDP)
Winner
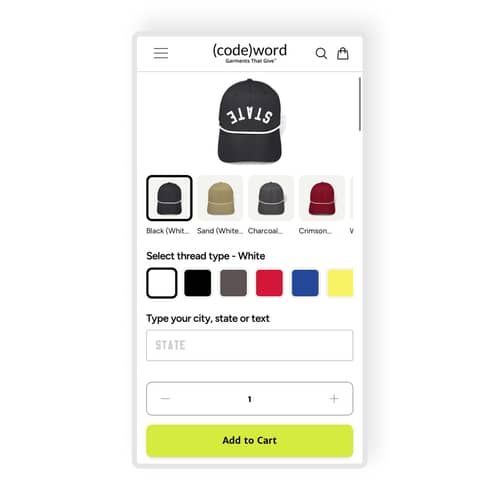
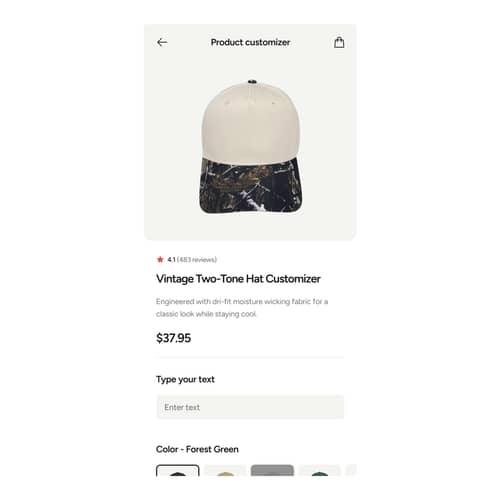
Enhanced Customization Flow
We tested adding placeholders for the input field in the customization process to improve conversions. Discover the impact on user behavior and key metrics.
+15.1% Conversion rate
Search & Navigation
Winner
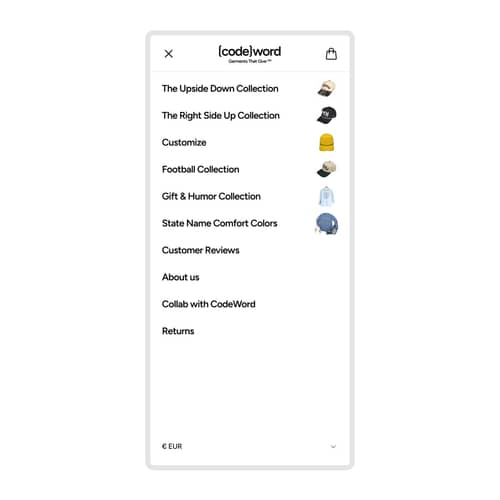
Navigation & Footer Redesign Boosts Desktop Engagement but Challenges Mobile Conversion
The navigation bar was redesigned to improve user engagement and browsing efficiency. Discover how these changes impacted conversions and user behavior.
-22.52% (CVR) CVR
Search & Navigation
Winner
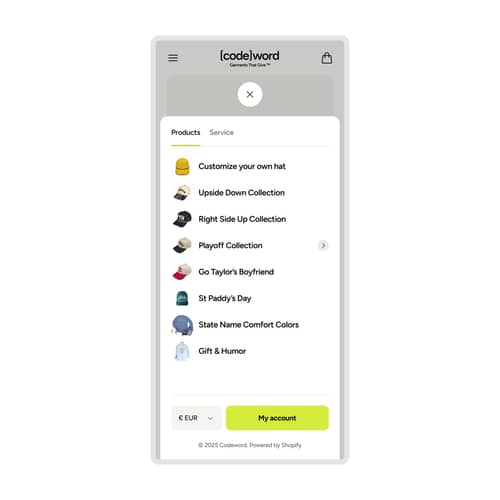
Updated Mobile Navigation Layout
Discover how updating the mobile navigation led to a 4.7% increase in add-to-cart rates for Codeword Hats. Learn more about the changes and their impact.
+5.4% Conversion rate
Cart
Winner
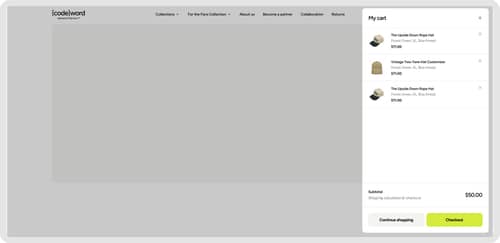
Redesigned mini cart boosts user engagement and checkout conversions
Discover how implementing a mini cart improved user engagement and increased checkout conversions by optimizing the shopping experience.
+3.6% Conversion rate
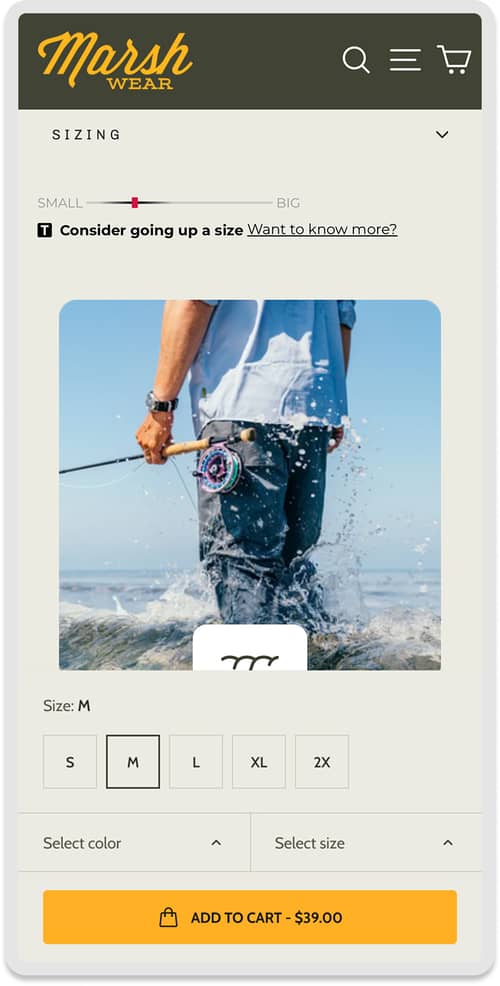
Product Page (PDP)
Winner
Enhanced Mobile Product Customizer
The mobile customization flow was adjusted, resulting in increased conversion and add-to-cart rates. Discover the impact of these changes.
+2.98% (CVR) CVR
Search & Navigation
Loss Prevented
Simplified Navigation Categories
Reducing navigation categories aimed to simplify the shopping experience but led to significant declines in conversion rate and revenue per visitor.
-20.67% (CVR) CVR

Homepage
Winner
Streamlining Mobile Shopping by Removing Discount Banners
Streamlined the mobile shopping experience by removing distractions. Learn how this change boosted engagement and conversions.
+12.14% (CTR) CTR
Homepage
Winner
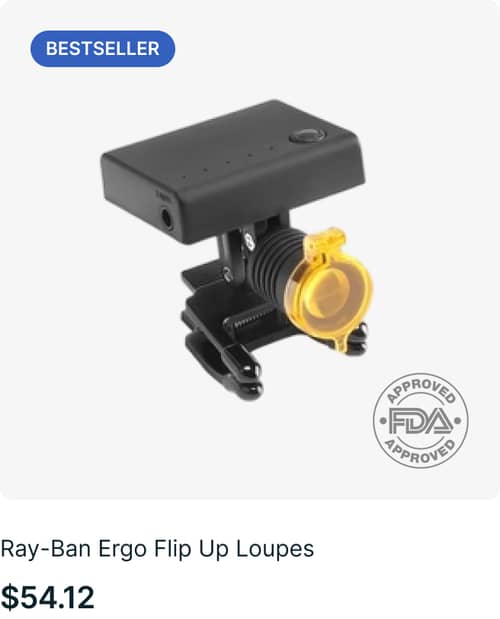
Enhanced Product Discovery with Badges
Badges were added to product cards to highlight key attributes. Discover how this change impacted user engagement and conversions.
+18.99% (CTR) CTR
Cart
Winner
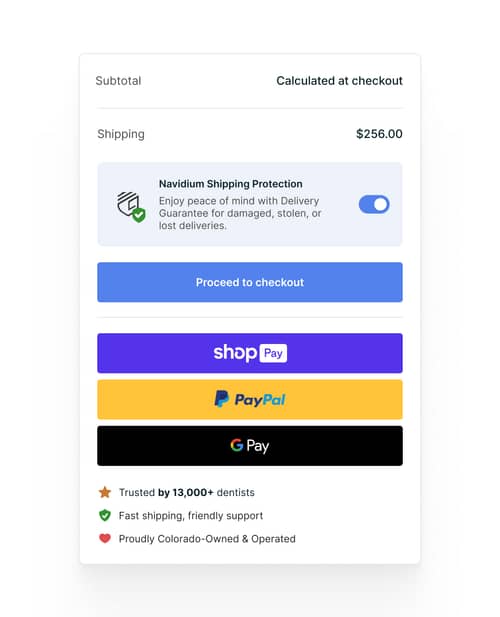
Trust Signals on Cart Page
Adding trust signals on the cart page led to an increase in conversions. Discover how these changes impacted user behavior.
+10.97% (CVR) CVR

Product Page (PDP)
Loss Prevented
Mobile Layout Optimization for AOV
Discover how mobile layout changes drove a 43.2% increase in average order value but came at the cost of conversion rate.
-28.29% (CVR) CVR
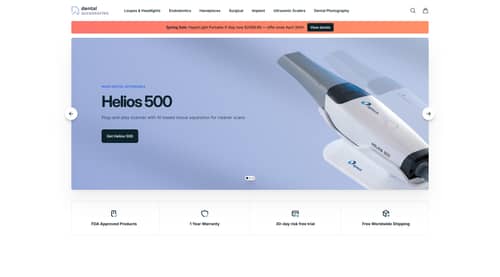
Homepage
Loss Prevented
Homepage product promotion carousel aims to boost high-value sales
An A/B test evaluated a homepage product promotion carousel to boost high-value sales. This analysis reveals the impact on conversion and revenue metrics.
-46.24% (CVR) CVR
Product Page (PDP)
Inconclusive
Mobile Bottom Sticky Add-To-Cart Button
Implementing a sticky "Add to Cart" button on mobile increased the add-to-cart rate by 8.7%. Discover how this change impacted other key metrics.
+6.8% Add-to-cart rate