A/B Experiments
See the Tests That Generated $7.3M+ in Revenue
Explore real A/B tests and conversion experiments run for Shopify stores across multiple industries. Every test shown here includes actual data, implementation details, and measurable outcomes—no theoretical advice, just proven results.

Product Page (PDP)
Inconclusive
Enhanced Desktop Experience
Enhancing the desktop experience produced a modest 2.2% conversion rate lift and 1.0% add-to-cart gain, but results were inconclusive.
-0.36% (CTR) CTR
Product Page (PDP)
Inconclusive
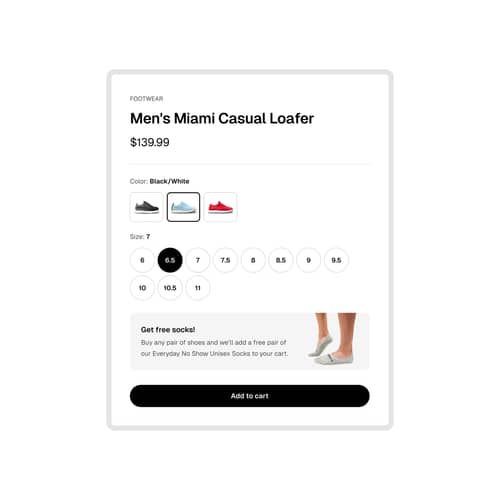
Free Socks Promotion
Adding a free pair of socks to shoe purchases was tested to boost conversion rates. Discover the impact of this promotion on sales performance.
-0.61% (CVR) CVR
Product Page (PDP)
Inconclusive
Optimized Mobile Layout
Optimizing the mobile layout produced a modest 3.4% conversion rate gain but led to higher bounce rates and lower add-to-cart rates.
-3.28% (CTR) CTR
Cart
Winner
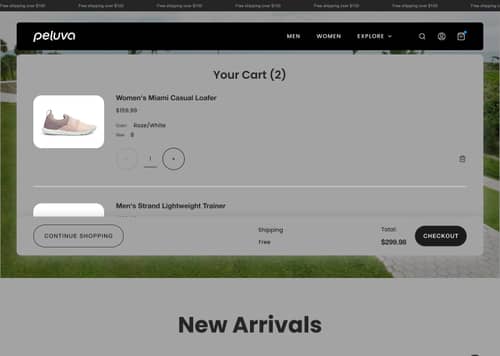
Mobile Checkout Optimization
Optimizing the mobile checkout flow drove a dramatic increase in conversion rate and doubled orders despite a visitor decline.
+0.00% (CVR) CVR

Product Page (PDP)
Inconclusive
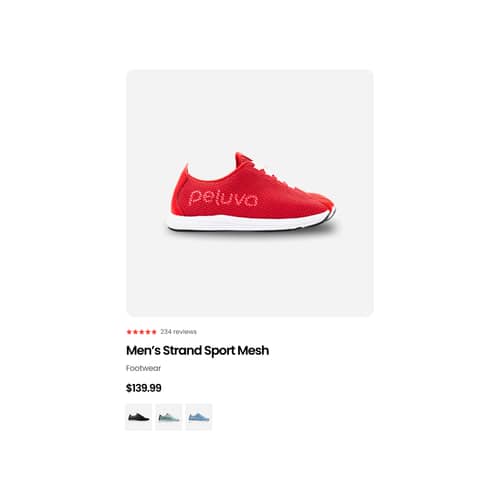
Simplified Product Descriptions
Simplifying product descriptions produced modest gains across conversion rate, AOV, and RPV, but none reached statistical significance.
+1.36% (CVR) CVR
Product Page (PDP)
Winner
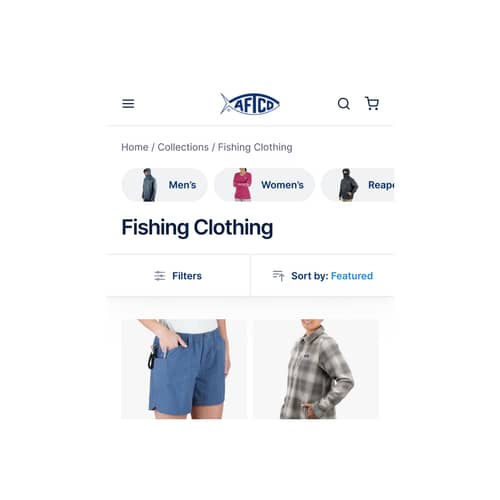
Streamlined Product Page Layout
Streamlining the product page layout drove a 9.0% conversion rate lift and 6.5% more orders, despite a decline in average order value.
+8.96% (CVR) CVR
Product Page (PDP)
Winner
Mobile Site Optimization
Mobile site optimization drove a 5.1% conversion rate lift and 7.9% RPV increase. Learn how performance and navigation improvements translated to more orders.
-3.79% (CVR) CVR
Product Page (PDP)
Winner
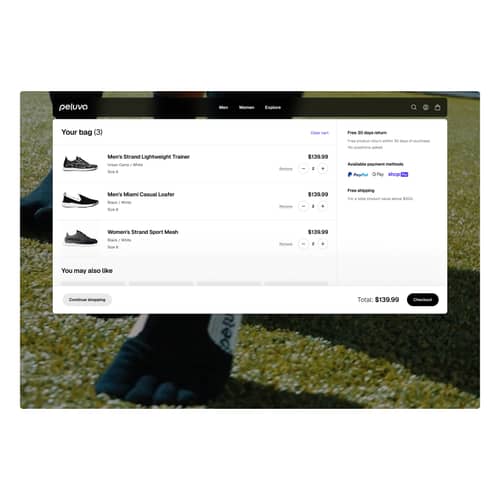
Enhanced Desktop Experience
The desktop experience was enhanced with improved navigation and visuals. See how add-to-cart rate lifted 7.1% and bounce rate dropped 4.7%.
+1.81% (ACR) ACR

Other
Loss Prevented
Adjusted Pricing Strategy
A pricing strategy adjustment increased AOV by 7.4% but caused a 17.5% conversion rate decline. Learn about the trade-offs and key takeaways.
-17.47% (CVR) CVR
Product Page (PDP)
Winner
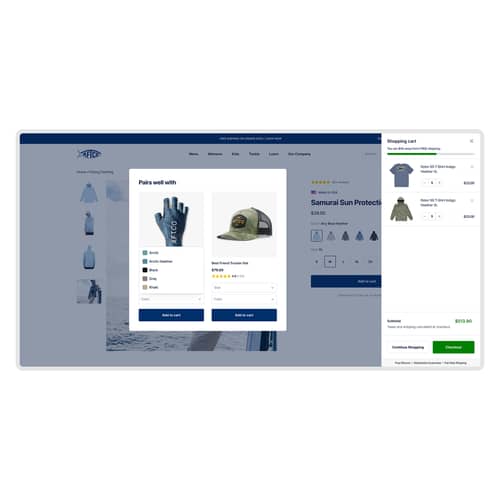
Optimized Product Page
Product page optimization drove a 9.7% conversion rate lift and 12.6% RPV increase. See how layout and image improvements delivered strong results.
+2.59% (AOV) AOV
Product Page (PDP)
Inconclusive
Updated Product Page Design
Updating the product page design produced marginal gains in AOV and RPV but no meaningful change in conversion rate.
-0.90% (CVR) CVR
Product Page (PDP)
Loss Prevented
Product Page AOV-Focused Redesign
A product page redesign focused on increasing average order value lifted AOV by 19.7% but decreased conversion rate by 9.9%.
+19.70% (AOV) AOV