A/B Experiments
See the Tests That Generated $7.3M+ in Revenue
Explore real A/B tests and conversion experiments run for Shopify stores across multiple industries. Every test shown here includes actual data, implementation details, and measurable outcomes—no theoretical advice, just proven results.

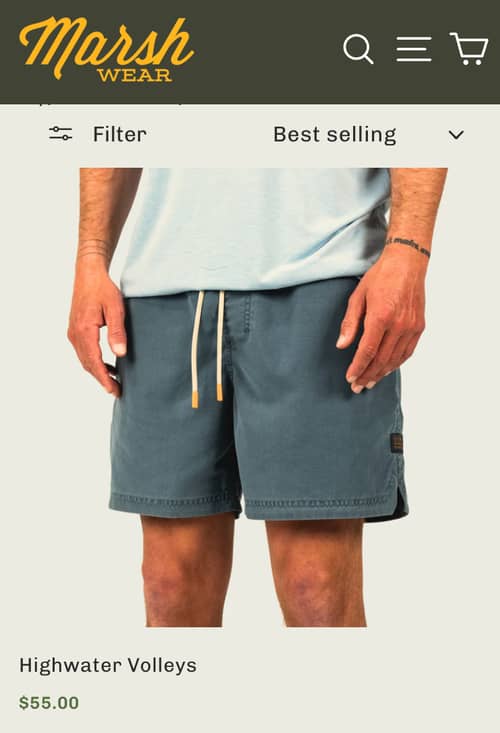
Collection Page (PLP)
Winner
Optimized Discount Price Styling
Discover how changing the styling of discounted prices impacted conversion rates and revenue for an e-commerce store.
+8.7% Conversion rate
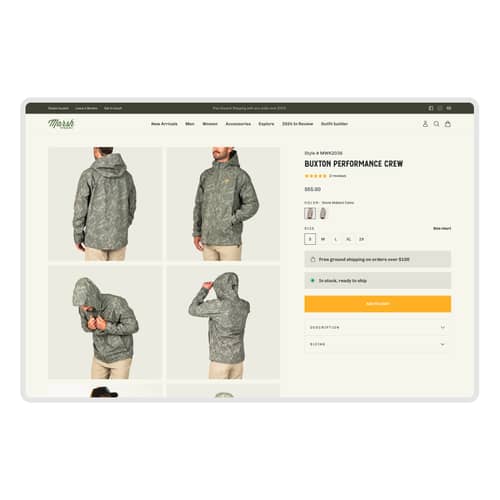
Product Page (PDP)
Winner
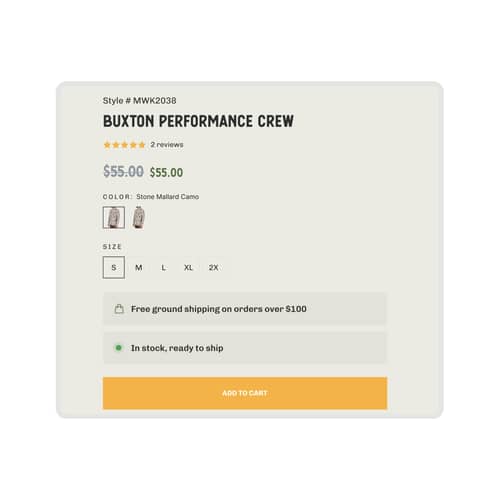
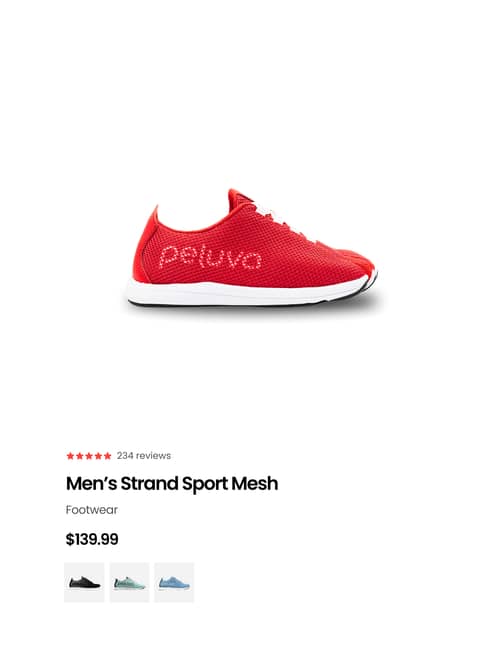
Enhanced Product Image Layout
Increasing the size and improving the layout of product images aimed to boost engagement and conversions. Discover how these changes impacted key metrics.
+11.9% Conversion rate
Product Page (PDP)
Loss Prevented
Simplified Mobile Layout
A simplified mobile layout increased average order value by 4.0% but led to higher bounce rates and lower conversion.
-4.2% Conversion rate
Search & Navigation
Loss Prevented
Mobile Navigation Redesign
The mobile navigation was redesigned to improve user experience, but the changes led to lower add-to-cart rates and higher bounce rates.
-3.2% Clickthrough rate
Product Page (PDP)
Inconclusive
Mobile Experience Enhancement
Enhancing the mobile experience drove a 15.3% AOV increase and 15.9% RPV gain with flat conversion rate.
+0.27% (CVR) CVR
Product Page (PDP)
Winner
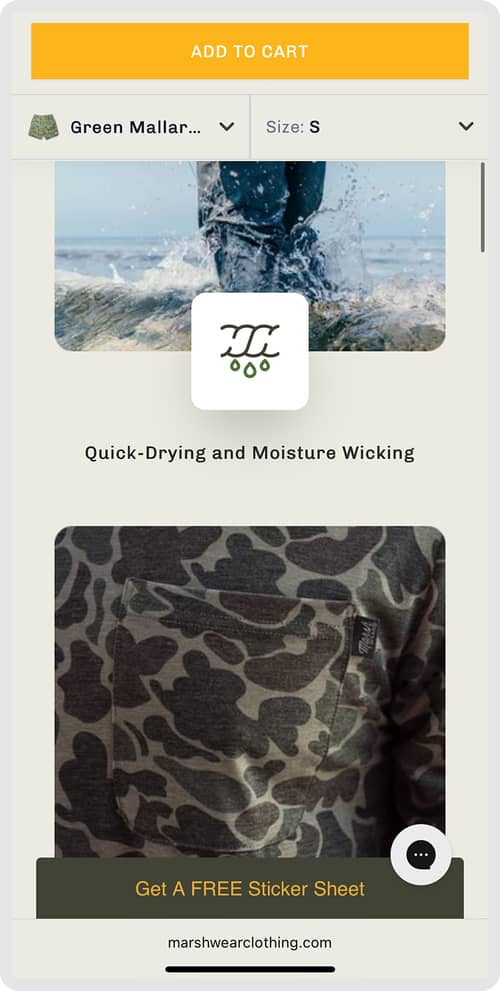
Sticky Top Add-To-Cart Button
Introducing a sticky Add to Cart button on mobile increased conversion rates by making it easier for users to purchase without scrolling.
-0.5% Add-to-cart rate
Product Page (PDP)
Winner
Enhanced Discount Price Styling
A test was conducted to display discounted prices in a smaller font than original prices. This change aimed to improve the perception of deals and increase conversions.
+3.0% Conversion rate
Collection Page (PLP)
Inconclusive
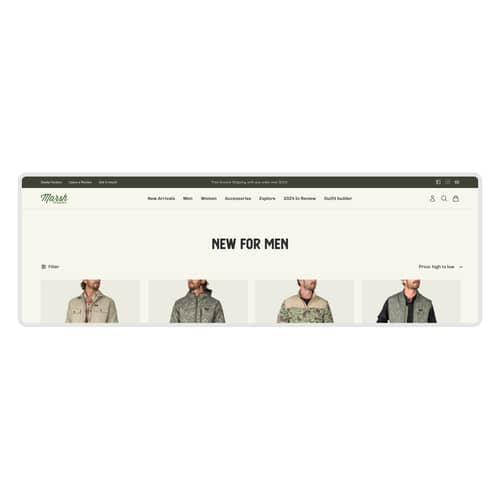
Displaying Collection Name
Adding the collection name to the top of the page aimed to improve customer navigation. Discover the impact on conversion rates and user engagement.
-1.0% Conversion rate
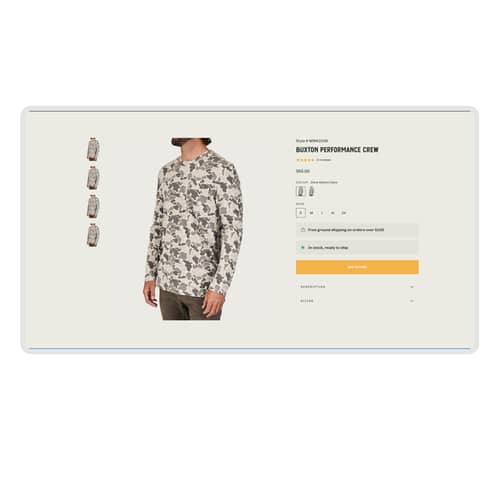
Product Page (PDP)
Inconclusive
Simplified Product Descriptions
Marsh Wear tested simplifying product descriptions to see if it would impact sales. The result was flat conversion with a slight RPV gain.
+1.78% (CTR) CTR
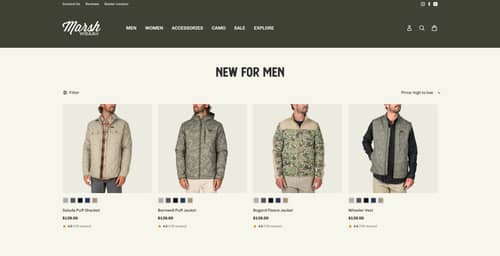
Homepage
Winner
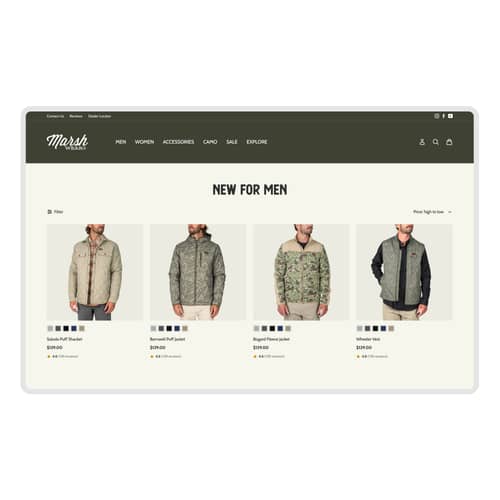
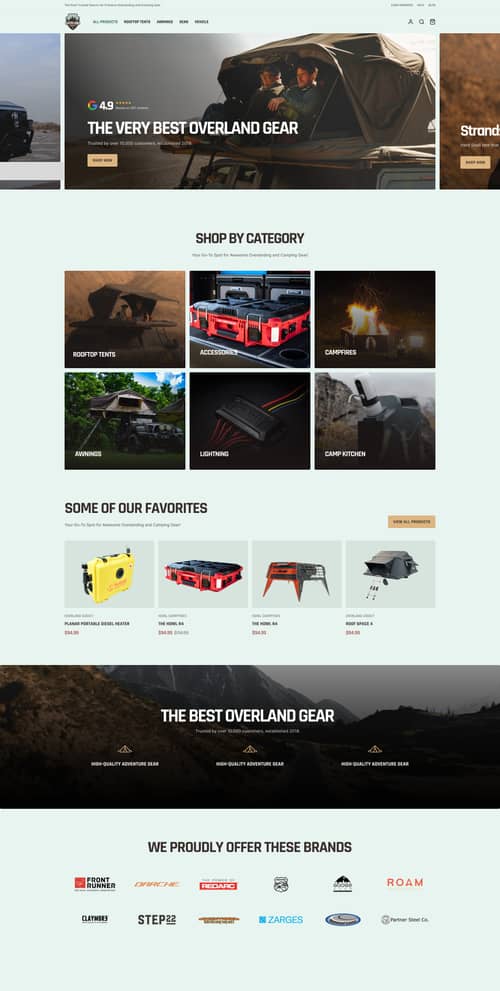
Homepage Redesign Boosts Conversion Rates
We redesigned the homepage and added trust elements to boost user confidence. Discover how these changes improved engagement and conversions.
+66.42% (CVR) CVR
Product Page (PDP)
Winner
Simplified Product Page
Simplifying the product page produced a 26.5% conversion rate lift across all devices, with mobile up 54.7% and desktop up 25.6%.
-12.67% (CTR) CTR

Cart
Loss Prevented
Simplified Checkout Process
Simplifying the checkout process by reducing steps and removing optional fields led to a 6.9% decline in conversion rate.
-6.87% (CVR) CVR