A/B Experiments
See the Tests That Generated $7.3M+ in Revenue
Explore real A/B tests and conversion experiments run for Shopify stores across multiple industries. Every test shown here includes actual data, implementation details, and measurable outcomes—no theoretical advice, just proven results.
Product Page (PDP)
Inconclusive
Display Product Badges on Main Image
Updating product pages to show badges on the main image led to mixed results in conversion rates across devices. Discover the impact on user engagement and revenue.
-0.5% Conversion rate
Product Page (PDP)
Inconclusive
Adding Return Policy Link on Product Pages
Adding a return policy link to product pages aimed to reduce purchase anxiety and answer questions about returns before they become objections. See how it impacted conversions and user engagement.
-1.4% Conversion rate
Collection Page (PLP)
Loss Prevented
Category Links on Collection Pages
Adding category links aimed to improve navigation and boost engagement. Discover how this change impacted key metrics.
-0.4% Conversion rate
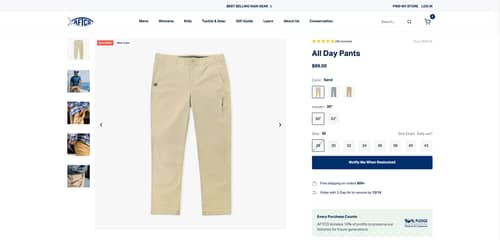
Product Page (PDP)
Winner
Restructured Product Page Accordion Layout
We updated the product page layout to show key details and moved reviews higher. Discover the impact on conversion and engagement.
+35.6% Revenue per visitor (RPV)
Product Page (PDP)
Winner
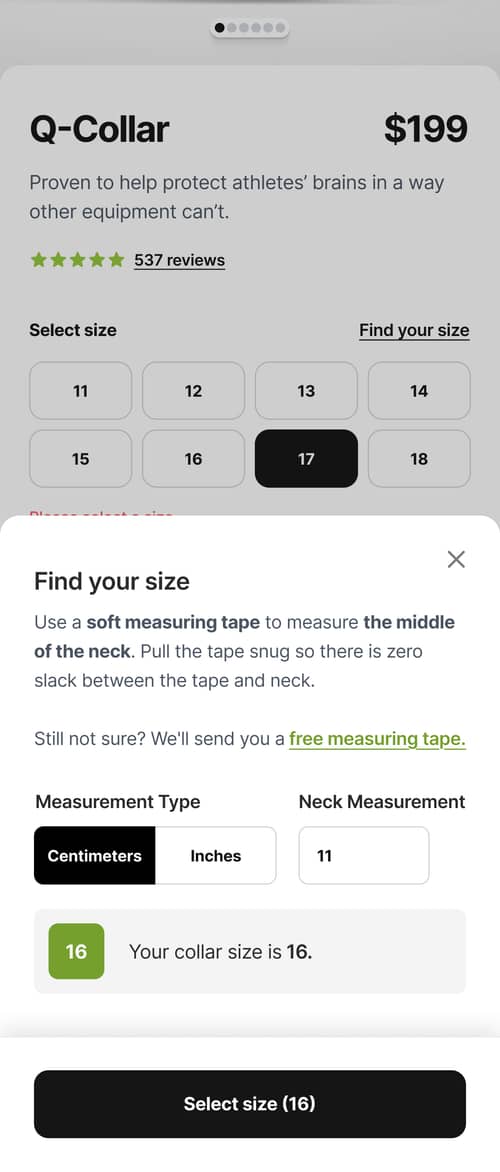
Redesigned “Find Your Size” Feature
We redesigned the “Find Your Size” feature to simplify the process. Read the full write-up.
+14.9% Revenue per visitor (RPV)
Homepage
Winner
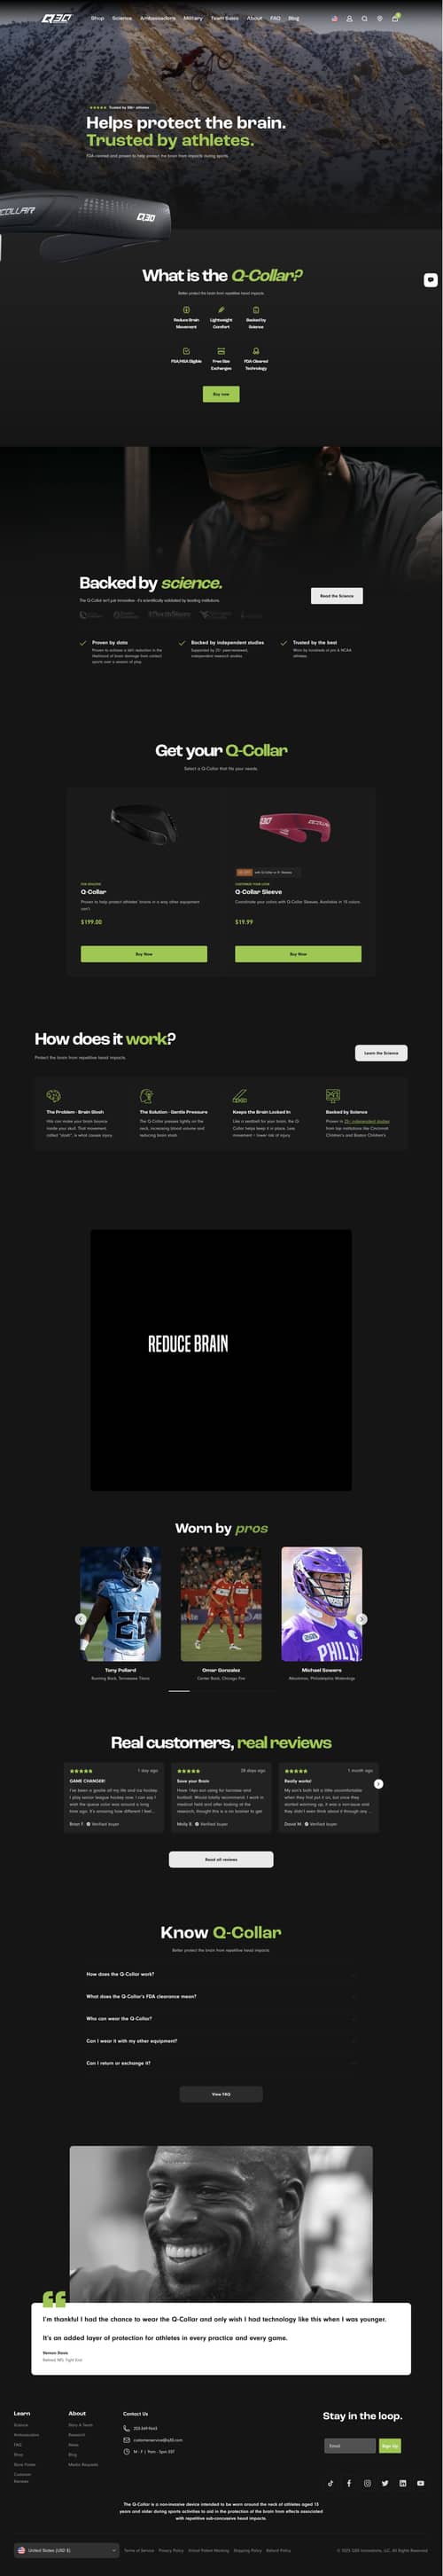
Personalized Homepage for New vs Returning Visitors
Learn how personalizing the homepage for new and returning visitors increased conversion rates significantly. Read the full write up.
+621.9% Revenue per visitor (RPV)
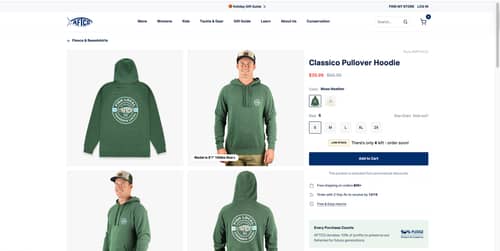
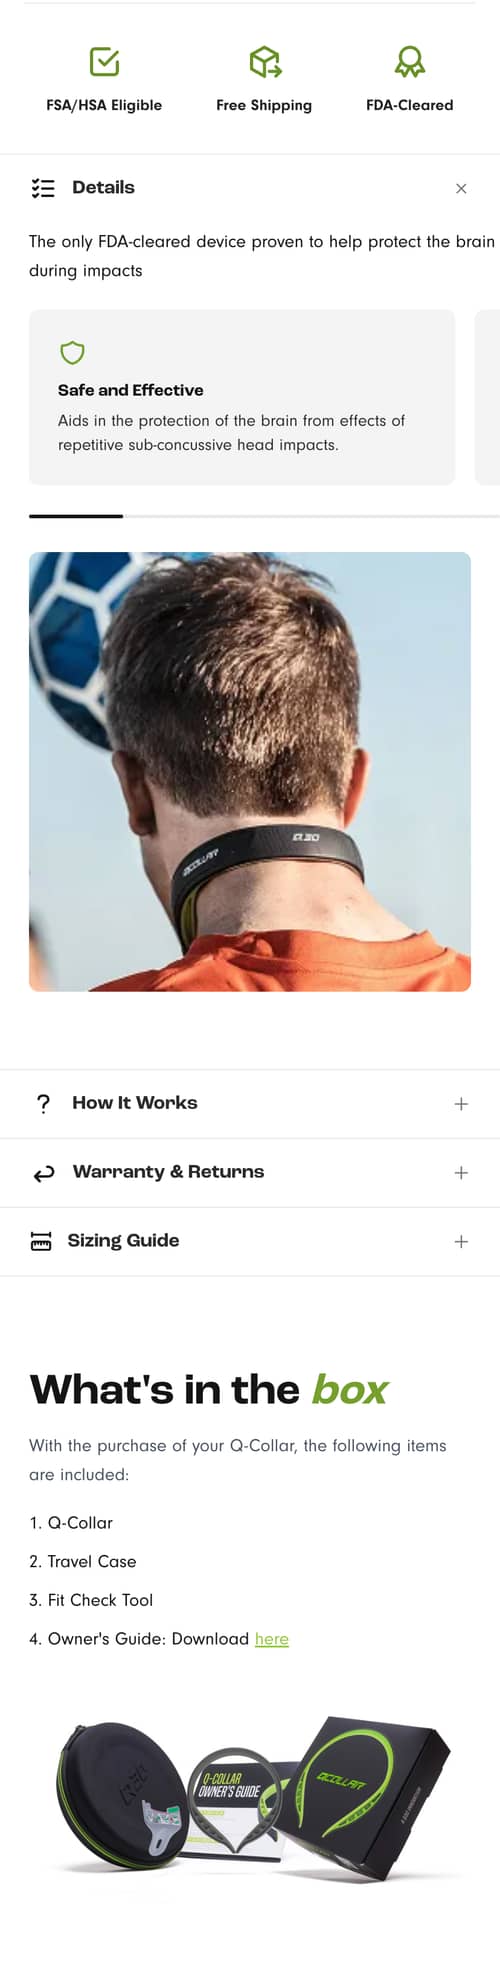
Homepage
Winner
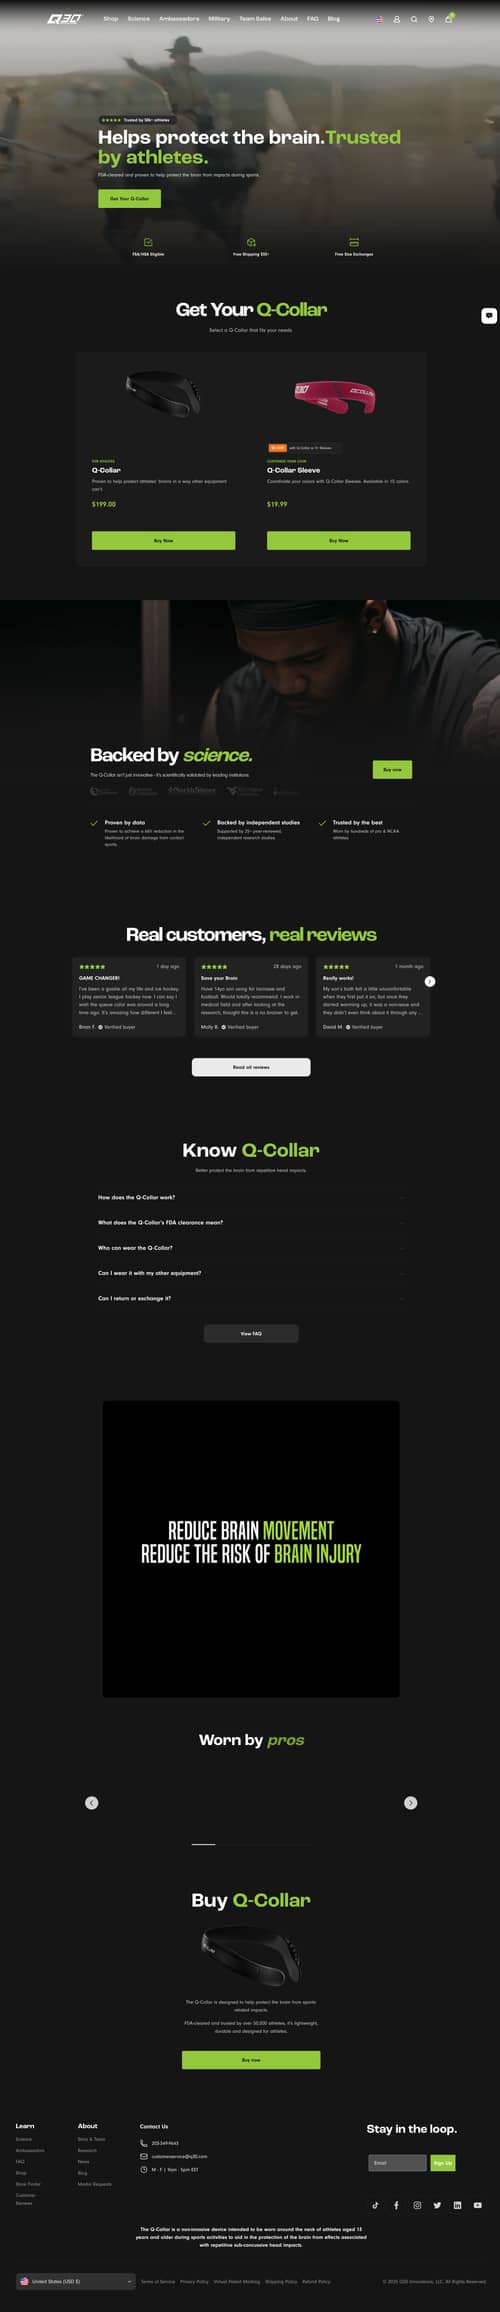
Redesigned Homepage With Extra "Educational" Content
Adding extra content to get ahead of customer objections, particularly around "how does the product work", saw the bounce rate drop and clickthrough rates increase. Read the full write-up.
+3.1% Revenue per visitor (RPV)
Collection Page (PLP)
Loss Prevented
Wider Collection Page
The desktop collection page was widened to improve product visibility and reduce clutter. Learn how this change affected user engagement.
+4.0% Clickthrough rate
Search & Navigation
Winner
Enhanced search results with clickable categories increase user engagement and conversions
We revamped the search feature to boost product relevance and category discovery. Discover how these changes drove significant improvements in key metrics.
+1.2% Clickthrough rate
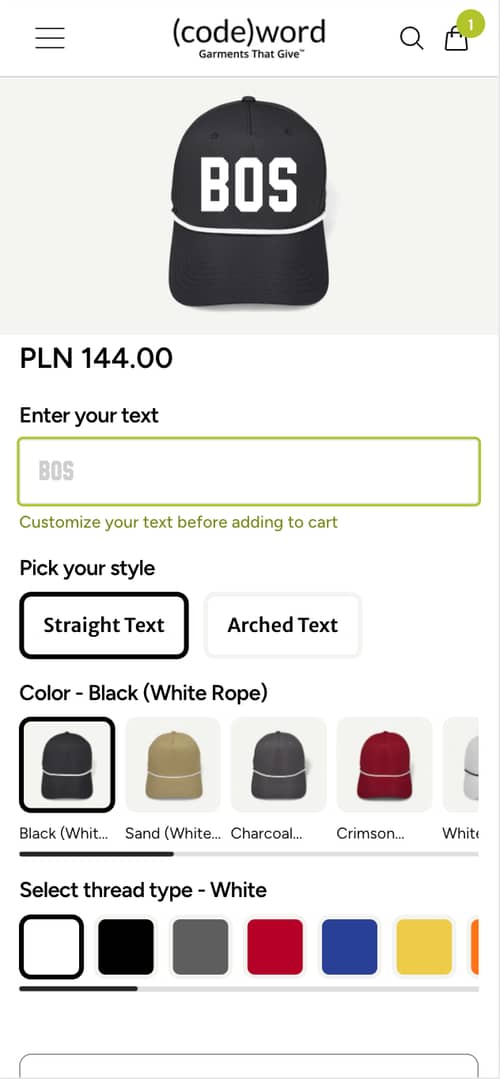
Product Page (PDP)
Inconclusive
Simplified Text Input Flow Boosts PDP Conversion and User Clarity
We simplified the text input process on the product pages. Learn how this change impacted user engagement and sales.
-3.1% Revenue per visitor (RPV)
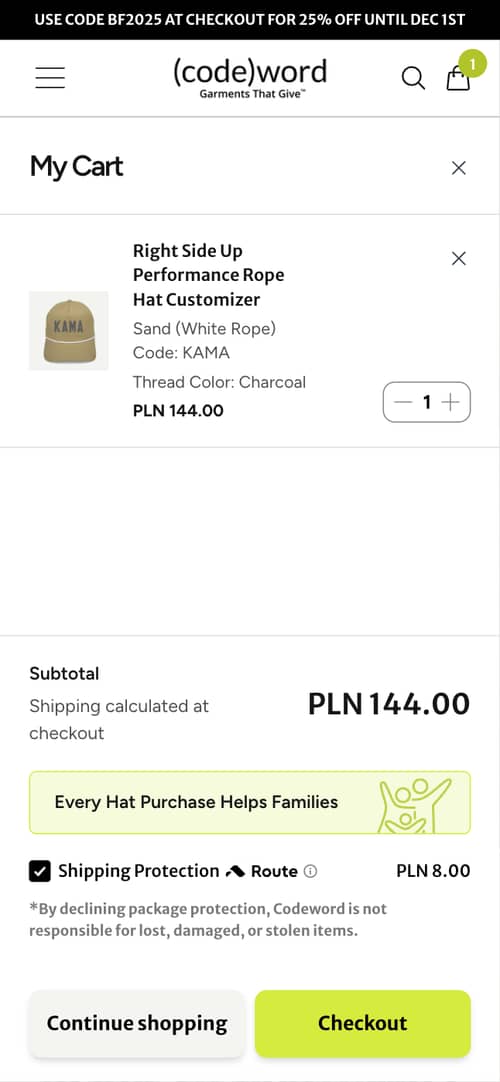
Cart
Inconclusive
Displaying a charity message in cart and checkout boosts customer motivation to complete purchases
We were exploring whether adding a charity support message during checkout improved the conversion rates or user engagement. View the outcomes of this test.
+3.3% Conversion rate

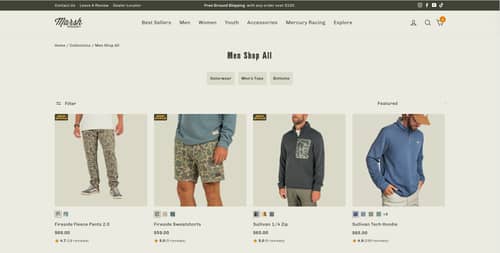
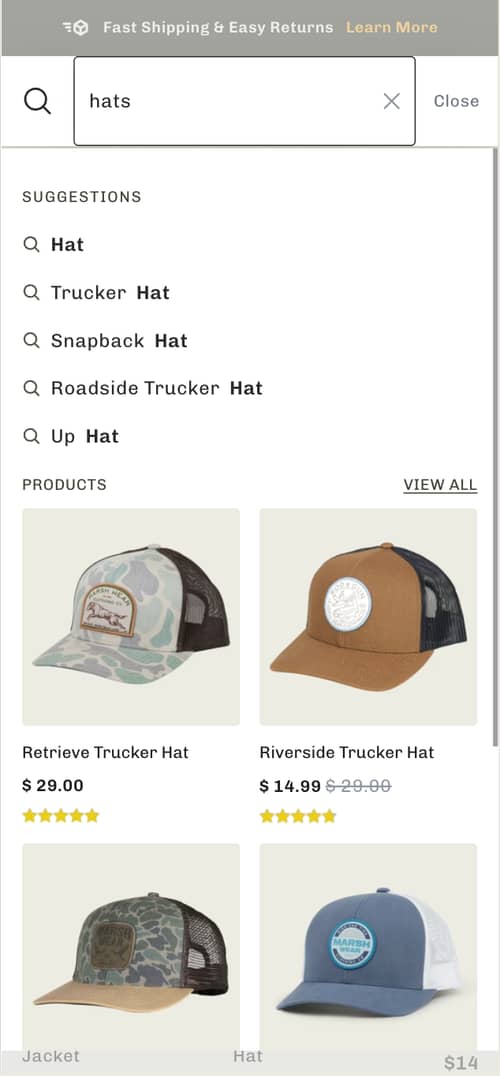
Search & Navigation
Inconclusive
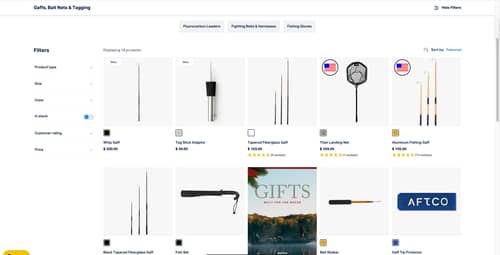
Repositioning “Hats” to top-level navigation increases visibility and user efficiency
Marsh Wear Clothing tested spotlighting the Hats category. Discover how this affected user interaction and sales.
-9.4% Clickthrough rate