 Talk to a human
A/B Experiments
See the Tests That Generated $7.3M+ in Revenue
Explore real A/B tests and conversion experiments run for Shopify stores across multiple industries. Every test shown here includes actual data, implementation details, and measurable outcomes—no theoretical advice, just proven results.
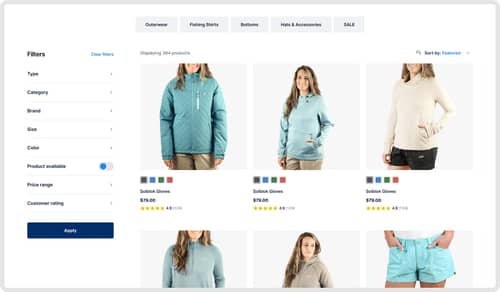
Collection Page (PLP)
Winner
Two-Column Filters Layout
A new layout with a left sidebar for filters improved user engagement and conversion rates. Discover how these changes impacted the browsing experience.
+7.6% Add-to-cart rate
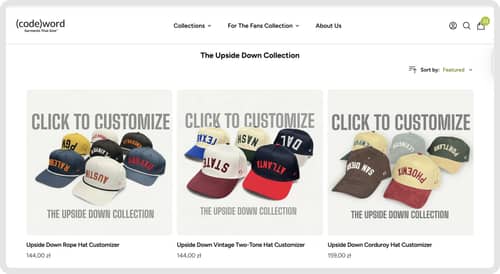
Homepage
Inconclusive
Homepage product cards with swatches improve engagement and conversions
An A/B test was conducted to enhance the desktop click-through rate for Codeword Hats. Discover how adjustments led to increased engagement.
-0.6% Conversion rate
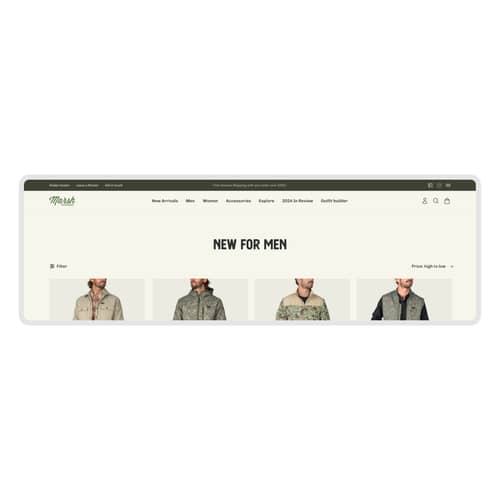
Search & Navigation
Winner
Navbar Redesign with Banner Color Testing
Improving the navbar layout and testing banner colors led to improved user engagement. Learn how these changes impacted key metrics.
+18.4% Add-to-cart rate
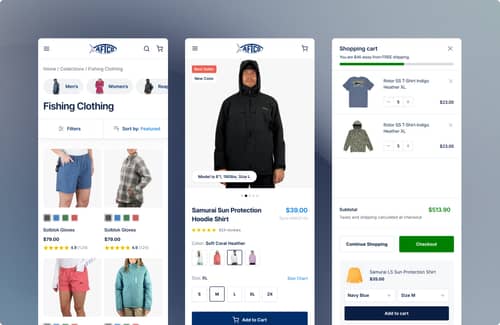
Collection Page (PLP)
Winner
Collection Page Redesign
We tested a new design for product pages to improve user engagement and sales. Discover the impact on key metrics.
+4.2% Conversion rate
Homepage
Winner
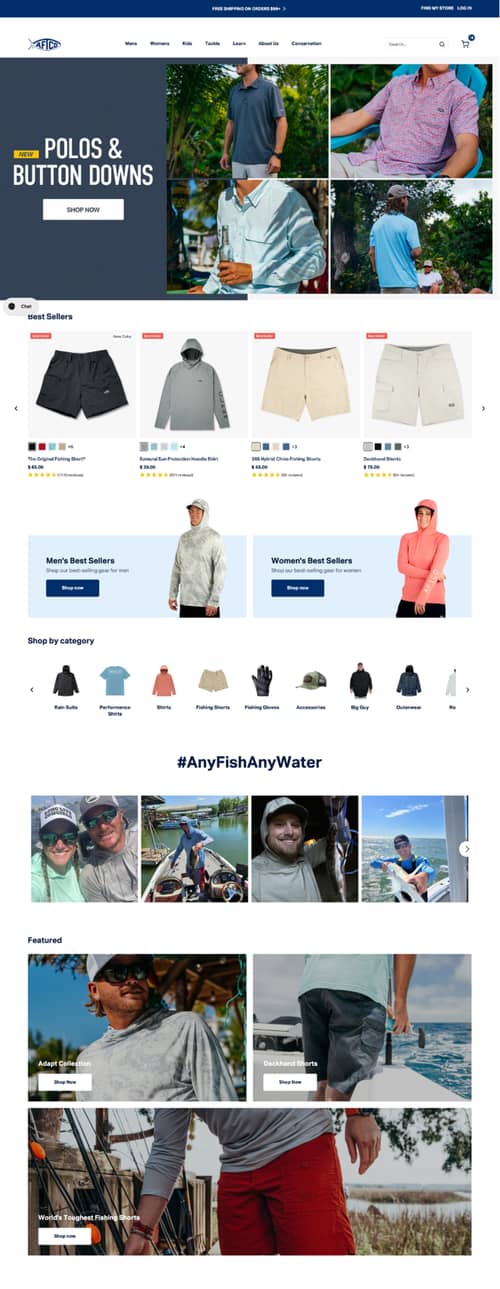
Adding Customer UGC to Homepage
Adding a user-generated content block to the homepage showcased real customer experiences and improved engagement. Discover how this change impacted key performance metrics.
+2.1% Clickthrough rate

Search & Navigation
Inconclusive
Simplified Navigation Bar Improves User Engagement
AFTCO tested a simplified navigation bar on their website to see if it would improve user engagement. Discover the impact on key metrics.
+3.80% (ACR) ACR
Product Page (PDP)
Winner
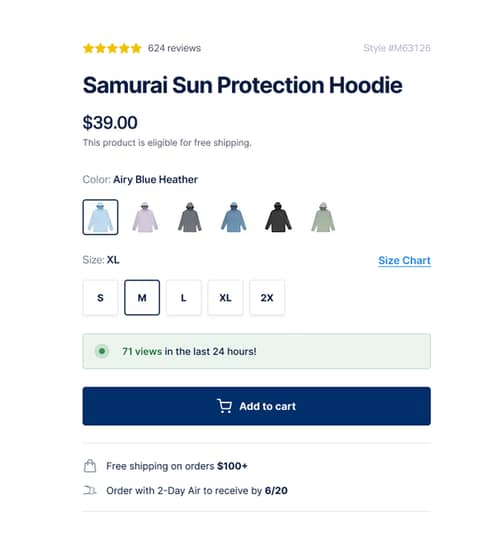
Adding Free Shipping Message Boosts Conversion
Adding a free shipping message to the product page was tested to see if it boosts conversions. Discover how this simple change impacted customer behavior.
+3.68% (CVR) CVR
Cart
Winner
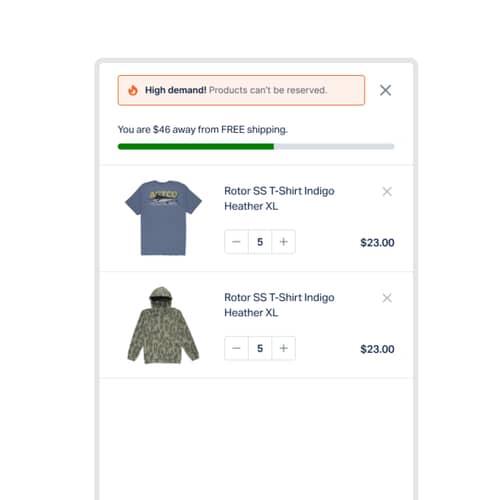
Scarcity Message Boosts Cart Conversion
Informing shoppers that items in their cart are in high demand increased conversion rates. Discover how urgency impacts purchase decisions.
+2.74% (CVR) CVR
Collection Page (PLP)
Winner
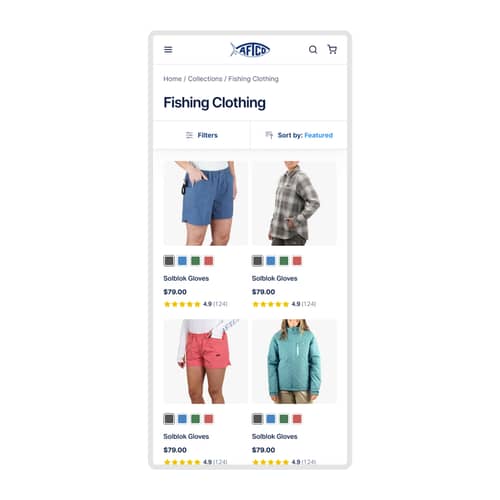
Hiding Collection Links
Removing collection links increased focus and improved key metrics on collection pages on mobile. Discover how this change impacted engagement.
+2.39% (CVR) CVR

Product Page (PDP)
Loss Prevented
Adding a cart icon to the "Add to Cart" button impacts user engagement and conversions
Adding a cart icon to the "Add to Cart" button aimed to improve clarity and usability. Discover how this change impacted conversion rates.
-10.64% (CVR) CVR
Product Page (PDP)
Winner
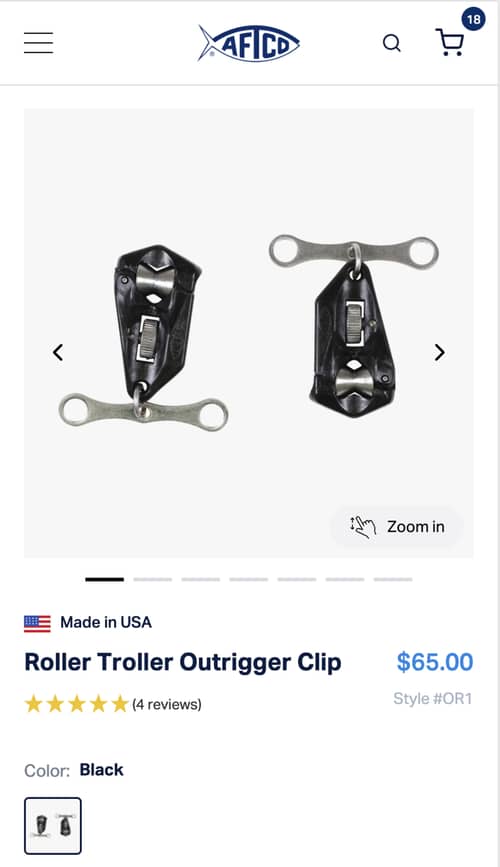
'Made in the USA' Icon Above Product Title
Placing the "Made in USA" icon above product titles increased conversion rates significantly. Discover the key insights from this strategic change.
+53.0% Conversion rate
Product Page (PDP)
Winner
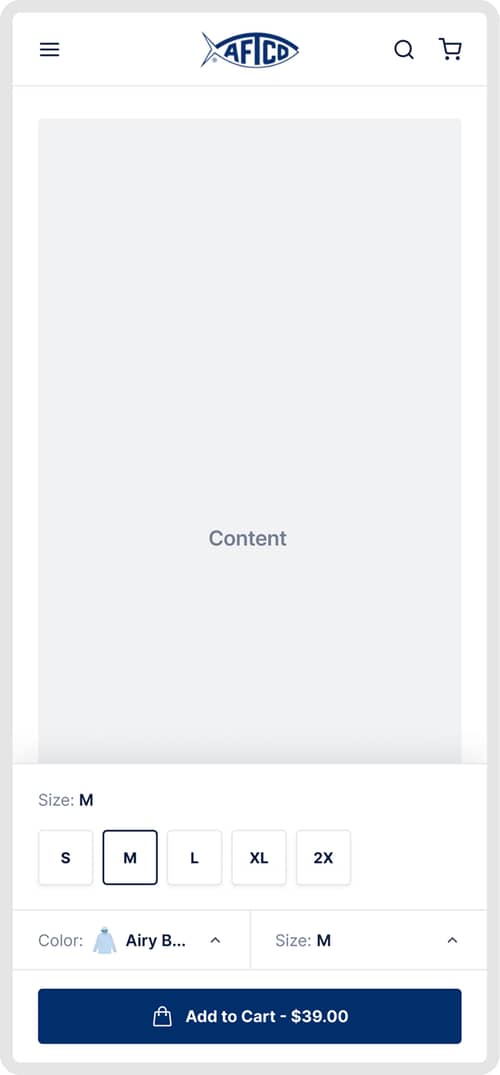
Sticky Mobile Add-To-Cart Button
AFTCO tested a sticky mobile add to cart button to increase add-to-cart rates. Learn how this change impacted user behavior.
+3.9% Add-to-cart rate