A/B Experiments
See the Tests That Generated $7.3M+ in Revenue
Explore real A/B tests and conversion experiments run for Shopify stores across multiple industries. Every test shown here includes actual data, implementation details, and measurable outcomes—no theoretical advice, just proven results.
Collection Page (PLP)
Inconclusive
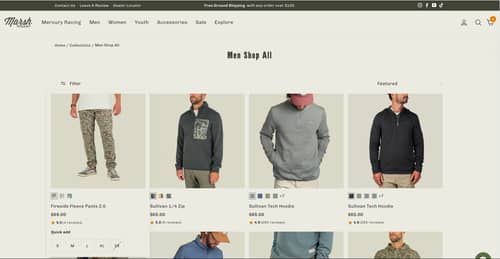
Desktop Collection Hover Sizing Buttons
Adding clickable size buttons on desktop product cards enabled direct add-to-cart actions, streamlining the shopping experience.
+7.3% Conversion rate
Banner
Winner
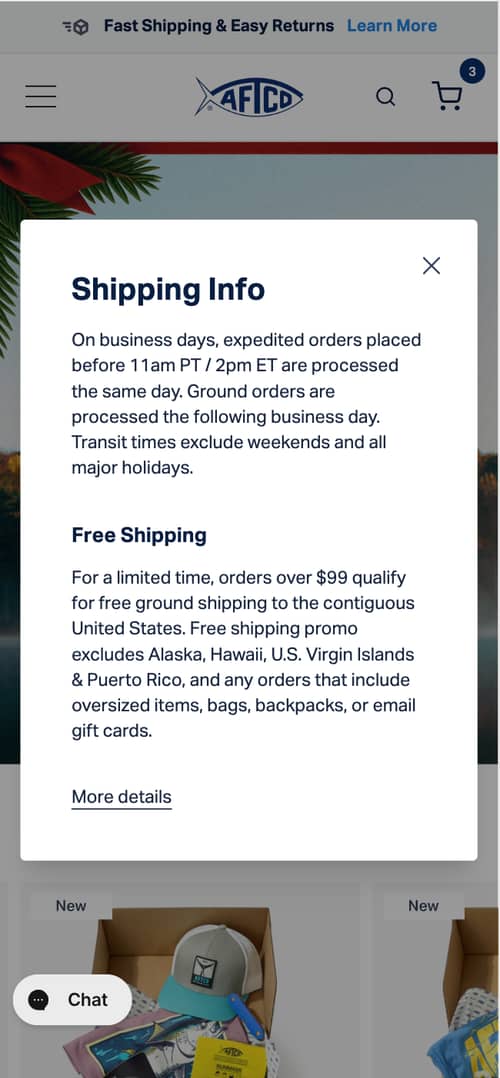
Shipping Banner with Info Modal
A shipping info banner was added to improve user confidence and increase conversions. See how this change impacted key metrics.
+4.7% Conversion rate
Banner
Winner
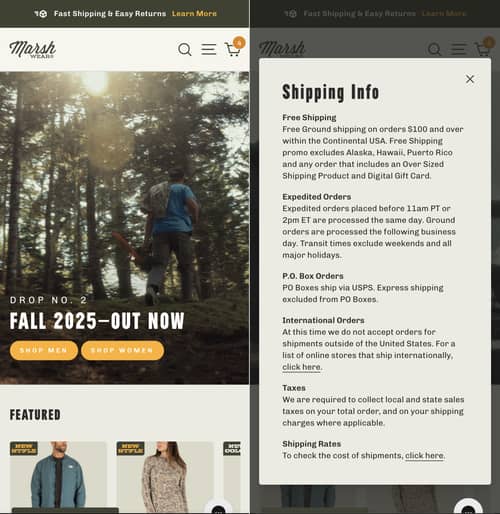
Shipping info banner that expand announcement bar information
A new shipping info banner was added to improve conversion rates by **reducing customer uncertainty**. Learn how this change impacted user behavior and sales.
+3.3% Conversion rate
Product Page (PDP)
Winner
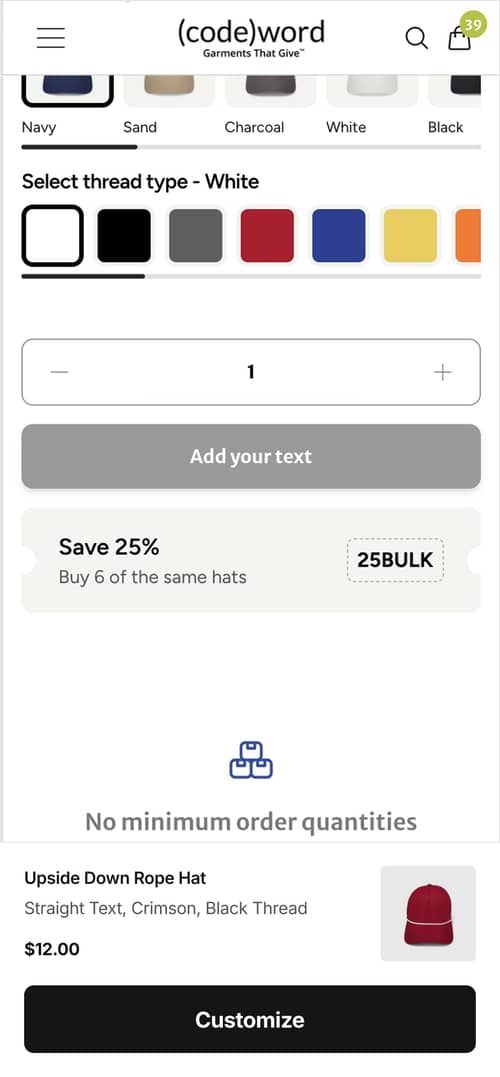
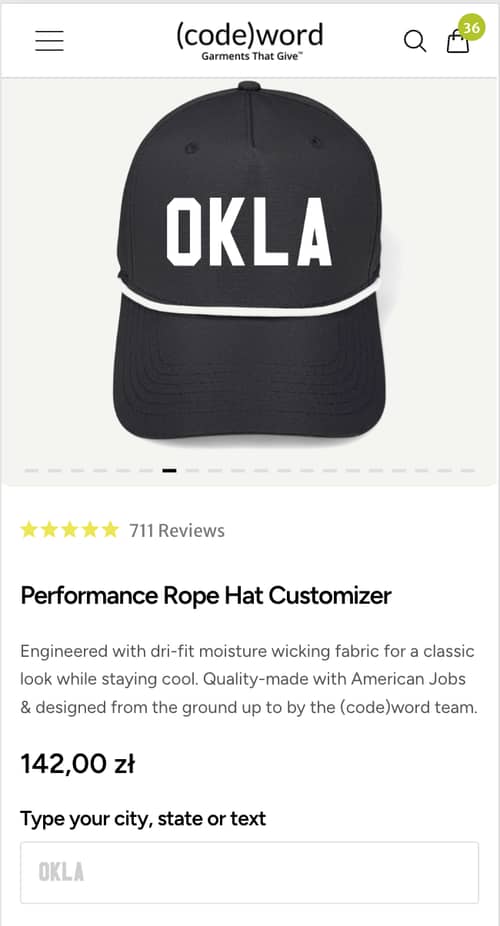
Sticky Product Customization Below The Fold
Transitioning the sticky product image to a sticky Add to Cart bar aimed to improve conversion rates by keeping purchase options visible during scrolling.
-14.4% Conversion rate
Homepage
Winner
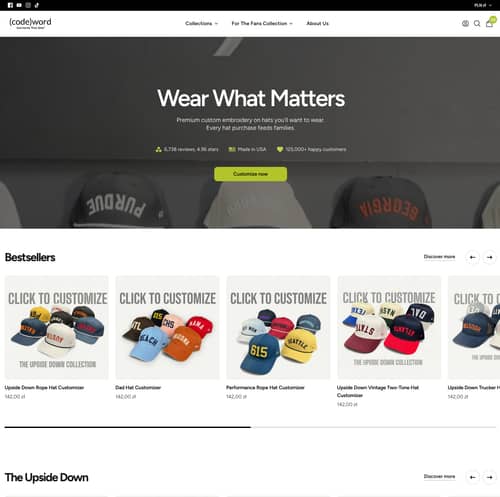
Best Sellers Module Added Below Hero
Adding a Best Sellers module on the homepage significantly boosted conversion rates, showcasing the impact of strategic product placement.
+16.9% Conversion rate
Landing Page
Winner
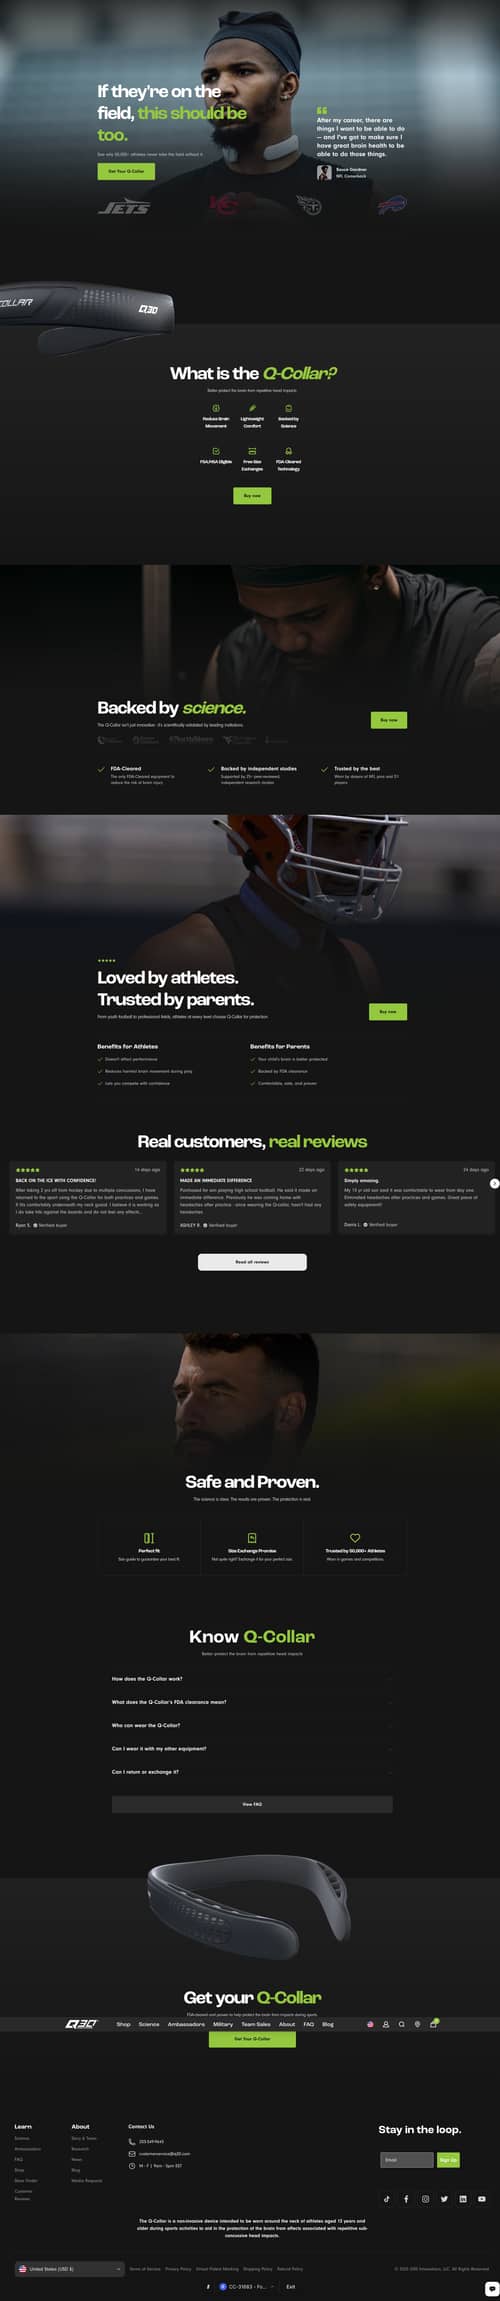
Redesigned Football Landing Page
Discover how a redesigned football landing page improved conversion rates and user engagement across devices.
+19.1% Conversion rate

Product Page (PDP)
Inconclusive
Personalized PDP Layout for Returning Visitors
Personalizing product pages for returning visitors aimed to boost conversion rates. Discover the impact on user engagement and sales.
-2.8% Conversion rate

Product Page (PDP)
Inconclusive
Personalized PDP Layout for New Visitors
Personalizing product pages for new visitors aimed to boost conversion rates. Discover the impact on user engagement and sales.
+1.9% Conversion rate
Collection Page (PLP)
Inconclusive
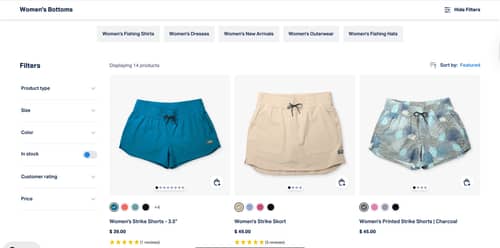
Collection Pages with Quick Add-to-Cart Button
Adding an "Add to Cart" button on mobile collection pages aimed to simplify the shopping process. Discover the impact on user engagement and purchasing behavior.
-5.6% Conversion rate
Homepage
Inconclusive
Adding 'Customise' Badge and Real-Life Images on Product Cards Boosts Visibility of Customizable Products
Adding a "Customise" badge and real-life images aimed to highlight customizable products. See how this impacted conversion and engagement metrics.
-5.0% Conversion rate
Product Page (PDP)
Winner
Condensed Product Gallery Increases Conversions
Reducing the product image gallery height increased key metrics by making critical purchase information visible without scrolling. Discover how this change improved conversions and user engagement.
+23.9% Conversion rate
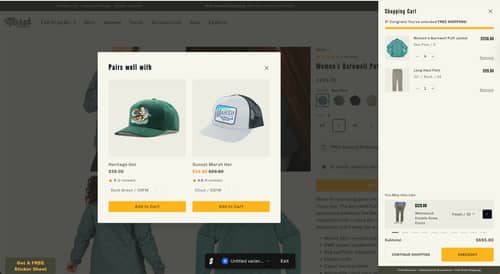
Product Page (PDP)
Winner
Enhancing AOV with Cross-Sell Pop-up Recommendations
Introducing a pop-up with complementary product suggestions increased average order value and conversions. Discover how this strategy impacted customer behavior.
+13.0% Average order value