A/B Experiments
See the Tests That Generated $7.3M+ in Revenue
Explore real A/B tests and conversion experiments run for Shopify stores across multiple industries. Every test shown here includes actual data, implementation details, and measurable outcomes—no theoretical advice, just proven results.
Product Page (PDP)
Winner
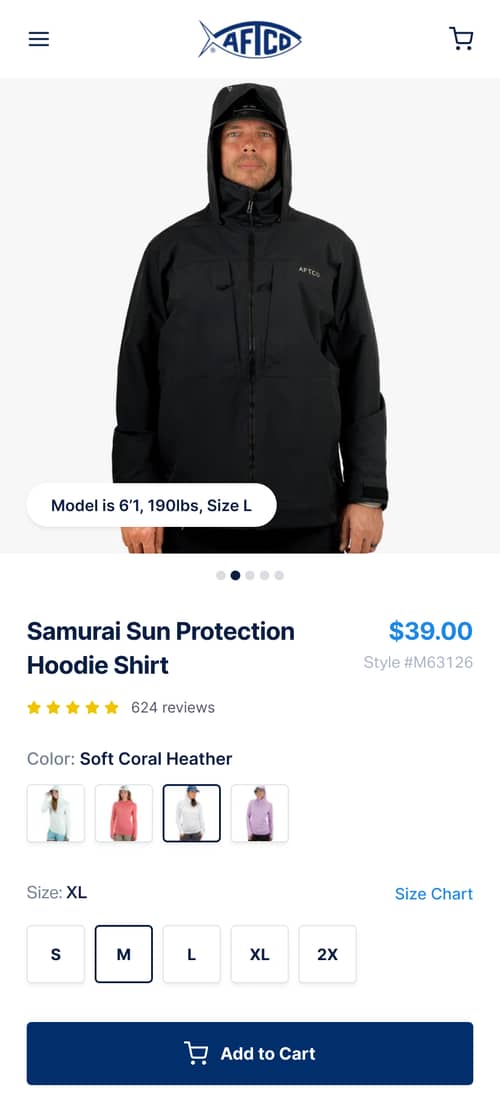
Modern Image Carousel Controls to Enhance Usability
The product detail page image carousel was redesigned to improve user engagement. Discover how these changes impacted customer interactions and sales.
+4.5% Add-to-cart rate
Product Page (PDP)
Inconclusive
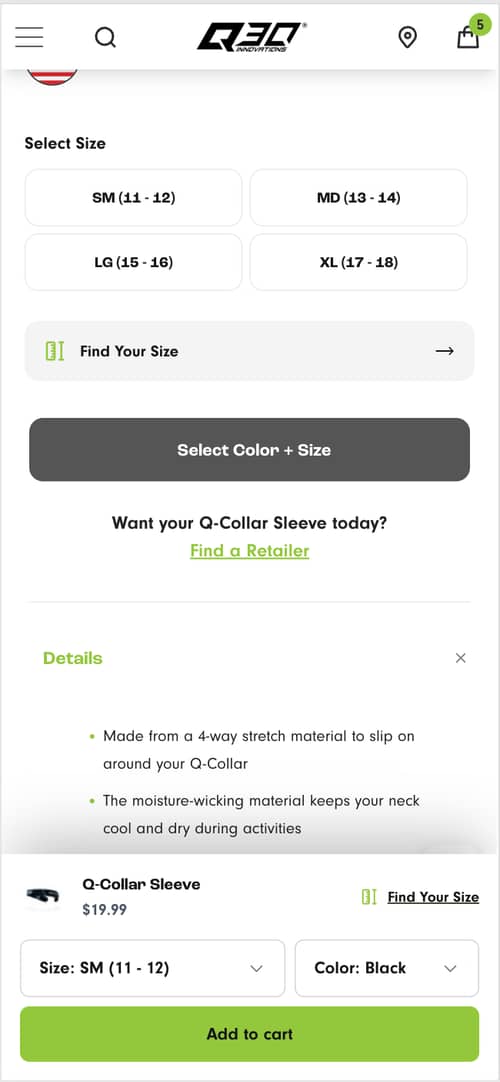
Sticky Bottom Add to Cart Bar
The mobile version of the website was adjusted to reduce the bounce rate. Learn how these changes impacted user engagement and conversion metrics.
+0.0% Conversion rate
Product Page (PDP)
Inconclusive
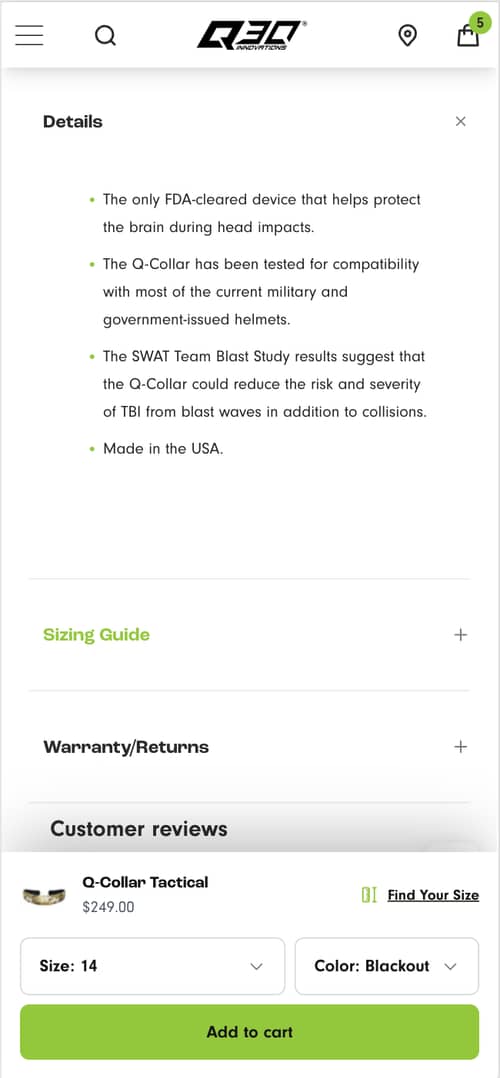
Tactical Bottom Sticky Add-to-Cart
The add-to-cart process was redesigned. Discover how these changes affected key metrics and overall performance.
-10.6% Conversion rate
Homepage
Winner
Enhancing Homepage Credibility with Curated User-Generated Content
A modular user-generated content carousel was tested to enhance authenticity and engagement. Discover how this change impacted key metrics.
+6.1% Conversion rate
Search & Navigation
Inconclusive
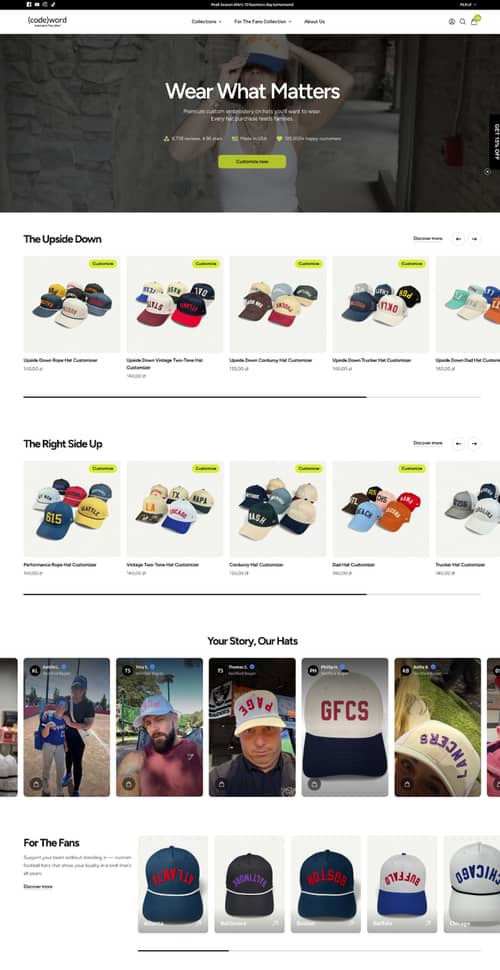
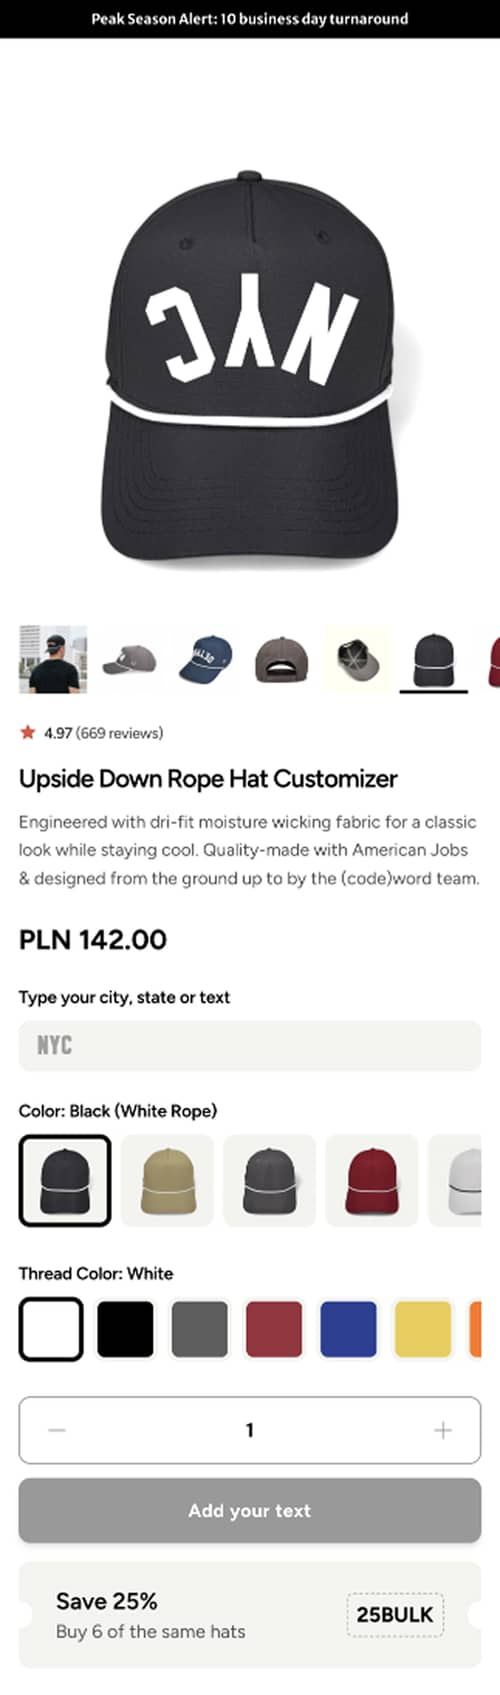
"Customize Your Own Hat" Button
Adding a persistent button to customize hats was tested to boost clickthrough rates by making customization options more visible. See the results of this test.
+15.4% Revenue per visitor (RPV)
Product Page (PDP)
Inconclusive
Product page redesign with updated fields boosts engagement and revenue
Changes to the product page led to increased engagement and higher revenue. Discover how these updates impacted key metrics.
+0.5% Conversion rate

Homepage
Winner
Highlighting HSA/FSA Eligibility Boosts Homepage Conversion and Revenue
Highlighting HSA/FSA eligibility on the homepage increased conversions. Discover how this simple change impacted customer behavior.
+12.1% Conversion rate
Homepage
Winner
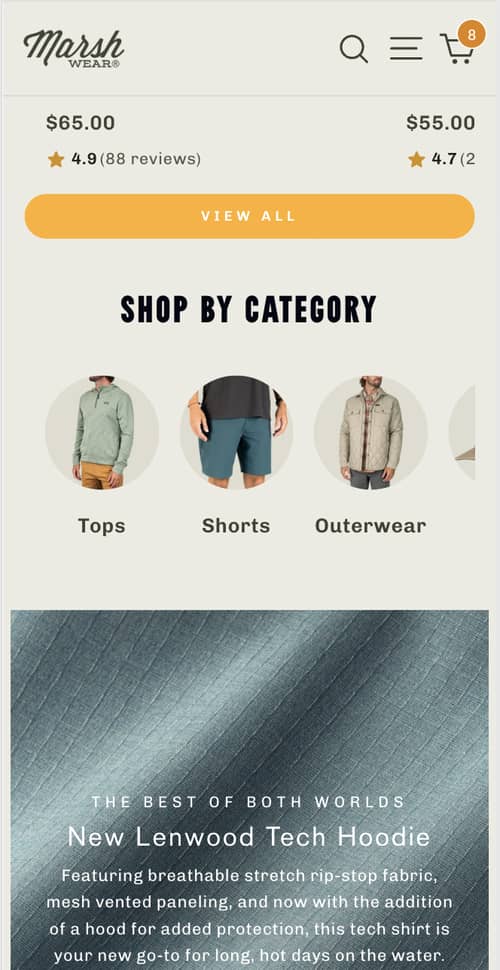
Category Links Boosts User Engagement and Conversions on Mobile
Adding category links to the homepage improved product discoverability, resulting in increased engagement and reduced bounce rates on mobile. Discover the full impact of this change in our latest case study.
+2.7% Clickthrough rate

Winner
Repositioning the chat pop-up significantly improves conversion rates across devices
The chat pop-up was moved to a less disruptive place, improving key metrics across devices. Discover how this simple change boosted conversions.
+44.5% Conversion rate
Product Page (PDP)
Loss Prevented
Adding Return Policy Link on Product Pages Boosts Customer Trust and Conversion Rates
Adding a return policy link to product detail pages aimed to boost conversions by reducing purchase hesitation. Discover how this change impacted key metrics.
-6.0% Conversion rate
Product Page (PDP)
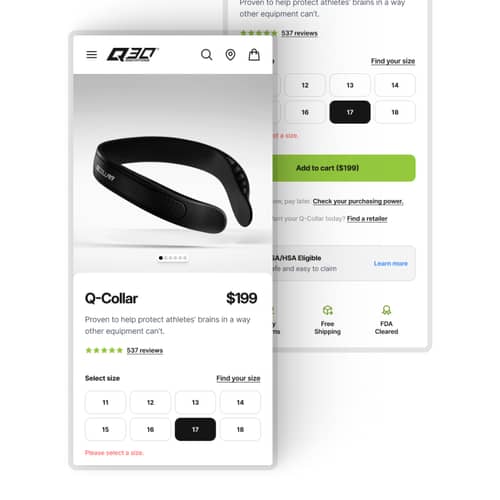
Winner
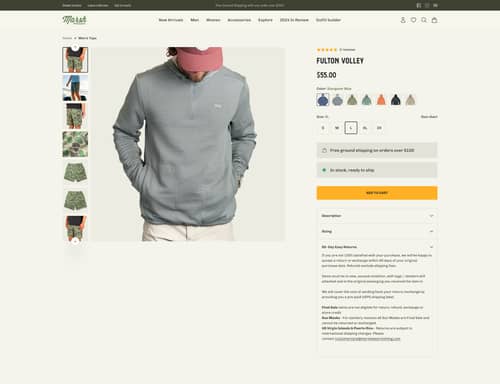
PDP Redesign Boosts Trust and Conversion Rates
Redesigning the product detail pages improved mobile conversions and visibility of key product information. Learn how these changes impacted user engagement.
+8.1% Conversion rate
Homepage
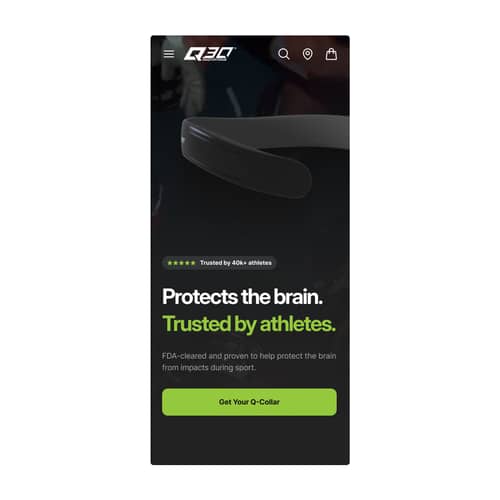
Winner
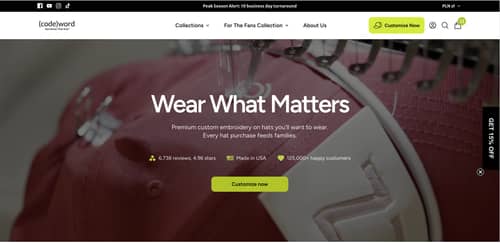
Homepage Hero Redesign Boosts Clarity and Conversion Rates
A redesign focused on clarity and trust improved key metrics, especially on mobile. Learn how specific changes led to increased conversion rates and revenue.
+11.0% Conversion rate