A/B Experiments
See the Tests That Generated $7.3M+ in Revenue
Explore real A/B tests and conversion experiments run for Shopify stores across multiple industries. Every test shown here includes actual data, implementation details, and measurable outcomes—no theoretical advice, just proven results.
Homepage
Winner
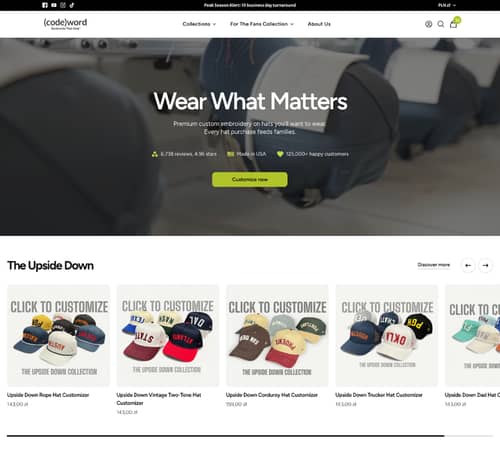
Homepage Redesign Boosts Engagement and Conversions
We redesigned the homepage to improve user experience, resulting in higher conversion rates and engagement. Discover how these changes impacted key metrics.
+8.0% Conversion rate
Product Page (PDP)
Winner
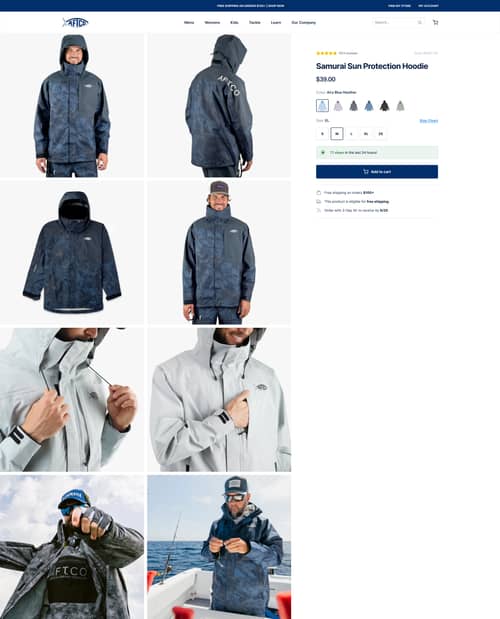
Product Image Grid Layout on Desktop PDPs
Switching to a grid layout for product images on desktop PDPs showed improved conversion and add-to-cart rates. Learn how displaying images efficiently can enhance user experience.
+3.0% Add-to-cart rate
Product Page (PDP)
Loss Prevented
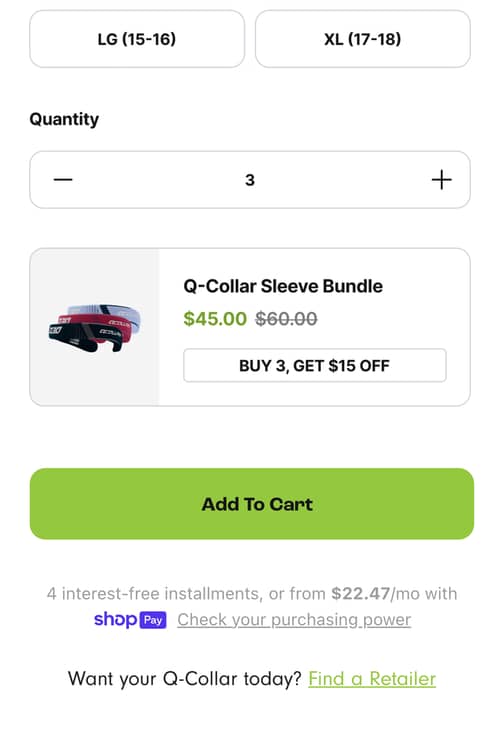
Promotional Bundle Message Near Add to Cart Boosts Mobile Engagement and Orders
Placing a promotional offer near the Add to Cart button aimed to increase average order value by encouraging multi-item purchases. Discover the impact on key metrics.
-7.9% Average order value
Cart
Loss Prevented
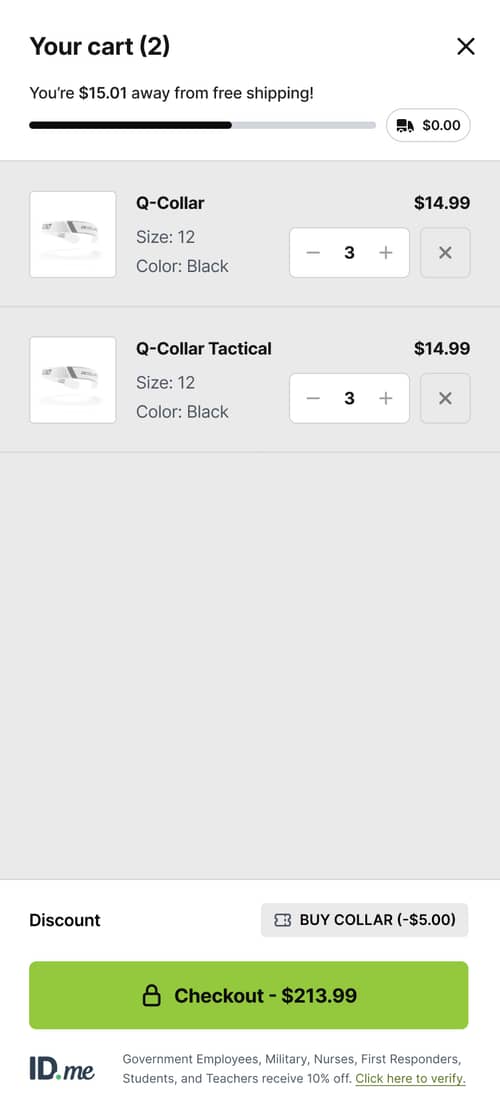
Minicart redesign increases checkout prominence and reduces distractions to boost conversions
The minicart was redesigned to prioritize the checkout button and remove distractions. Discover how these changes impacted conversion rates and user behavior.
-9.9% Conversion rate

Cart
Winner
Mini Cart Redesign Boosts Conversion
We redesigned the mini cart overlay to reduce clutter and enhance usability on mobile. Discover how this change influenced key performance metrics.
+7.5% Conversion rate
Product Page (PDP)
Inconclusive
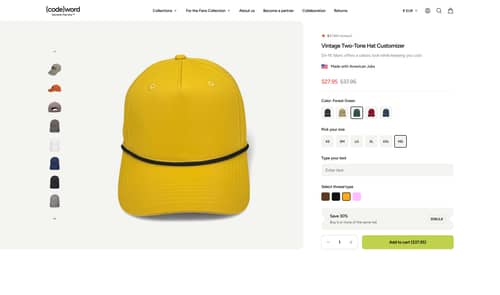
"Hand-Printed & Made with American Jobs" Badge
"Hand-Printed & Made with American Jobs" badge was added to product pages to highlight craftsmanship. Learn how this impacted customer engagement.
-2.4% Conversion rate

Landing Page
Winner
Direct Purchase Option Boosts Football Landing Page Conversion Rates
The test added a Buy Now card on the landing page to simplify purchasing. See how this change impacted conversion rates.
+4.2% Conversion rate
Landing Page
Winner
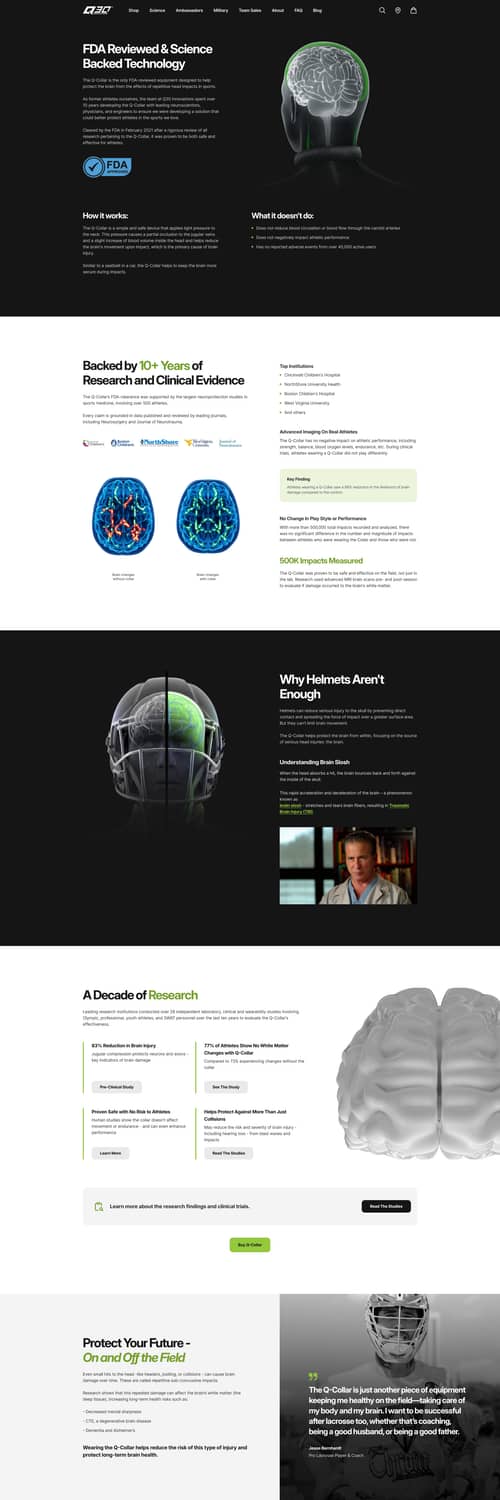
Simplified Science Content
The science page was simplified to improve readability, resulting in increased conversions and reduced bounce rates. Learn how these changes impacted user behavior.
+19.6% Revenue per visitor (RPV)
Homepage
Winner
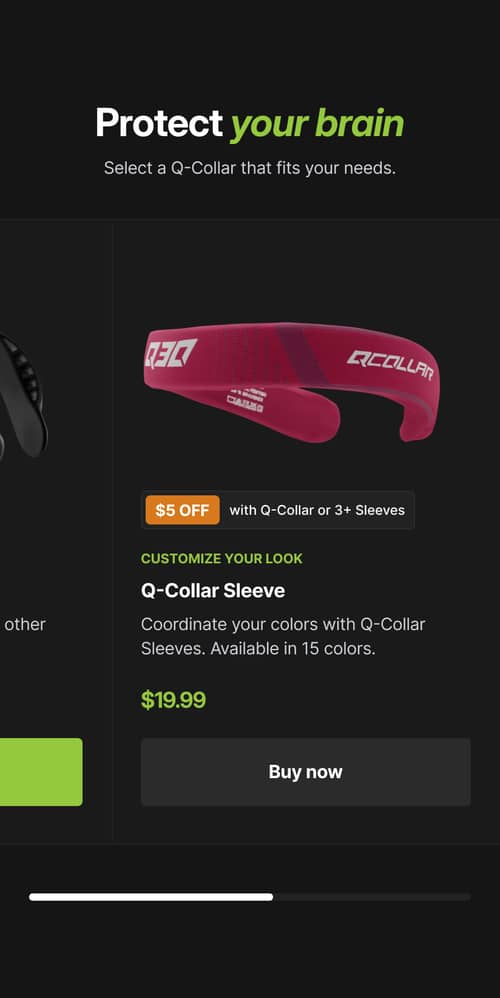
Replacing Recommended Product in the Buy Now Section
This case study explores the impact of replacing the Tactical Collar with the Collar Sleeve on the homepage. Discover how this change influenced key metrics like conversion and revenue.
+5.6% Conversion rate
Product Page (PDP)
Winner
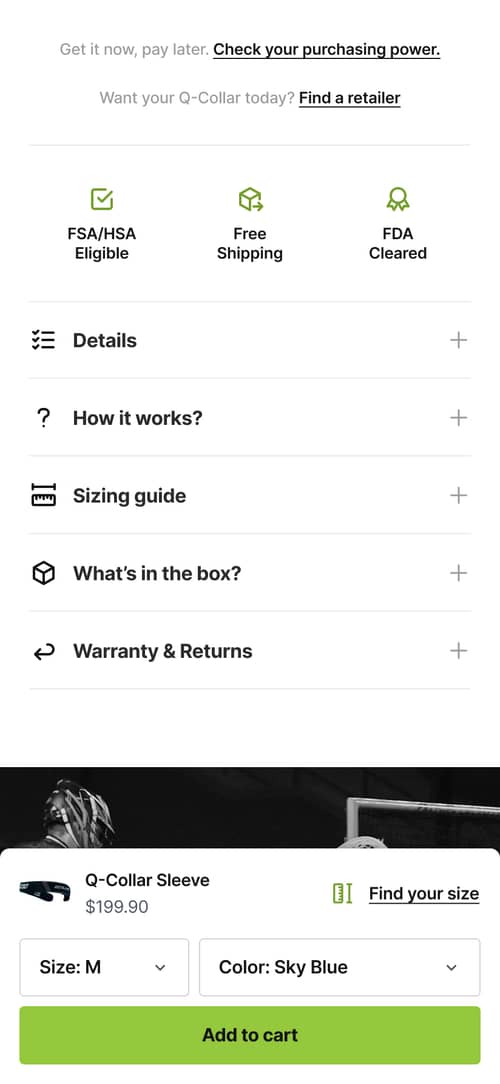
Sticky Top Add to Cart Bar with Size Selector
Introducing a sticky Add to Cart bar increased engagement and conversion rates by keeping purchase options always visible. Read on to discover the impact.
+2.2% Add-to-cart rate
Collection Page (PLP)
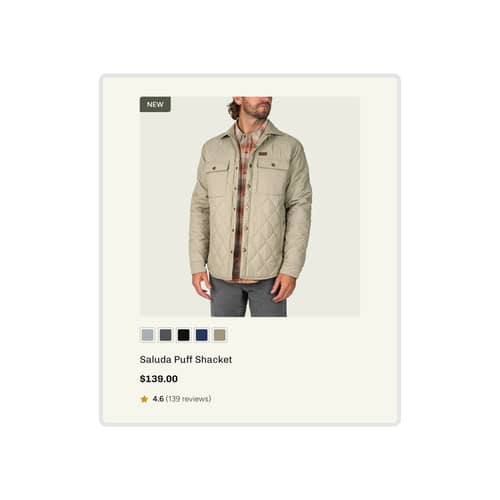
Winner
Product Card Redesign
We redesigned product cards to simplify browsing and added a color selector. See how these changes affected user engagement and sales.
+1.5% Conversion rate
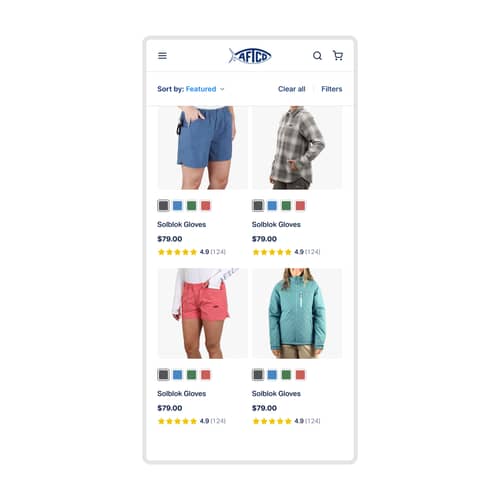
Collection Page (PLP)
Loss Prevented
Sticky mobile filters boost product discovery and navigation accessibility
Implementing sticky mobile filters aimed to streamline product discovery by keeping filters accessible while browsing. Discover the impact on user engagement and sales.
-16.0% Conversion rate