A/B Experiments
See the Tests That Generated $7.3M+ in Revenue
Explore real A/B tests and conversion experiments run for Shopify stores across multiple industries. Every test shown here includes actual data, implementation details, and measurable outcomes—no theoretical advice, just proven results.
Collection Page (PLP)
Inconclusive
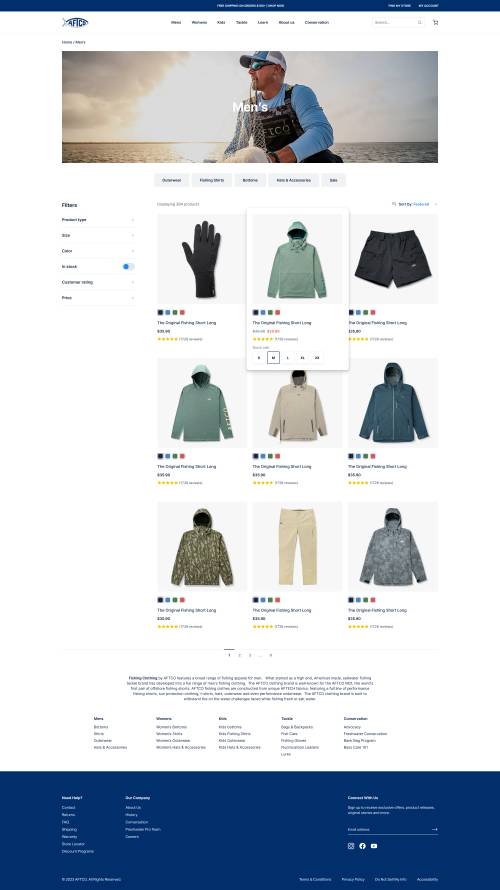
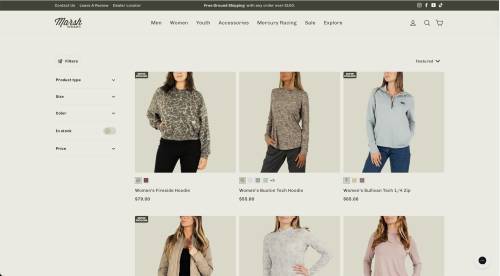
Clickable size buttons on collection pages
Adding clickable size buttons to product cards on desktop streamlined the shopping process, enhancing the add-to-cart rate.
+0.0% Conversion rate
Product Page (PDP)
Winner
Delaying promo pop-up boosts user engagement
Delaying the promotional pop-up by 60 seconds increased mobile conversion rates. Discover how this timing adjustment improved user engagement.
+7.9% Conversion rate
Product Page (PDP)
Loss Prevented
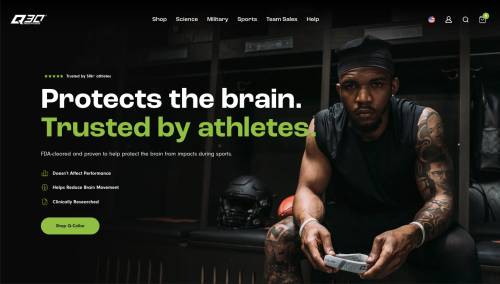
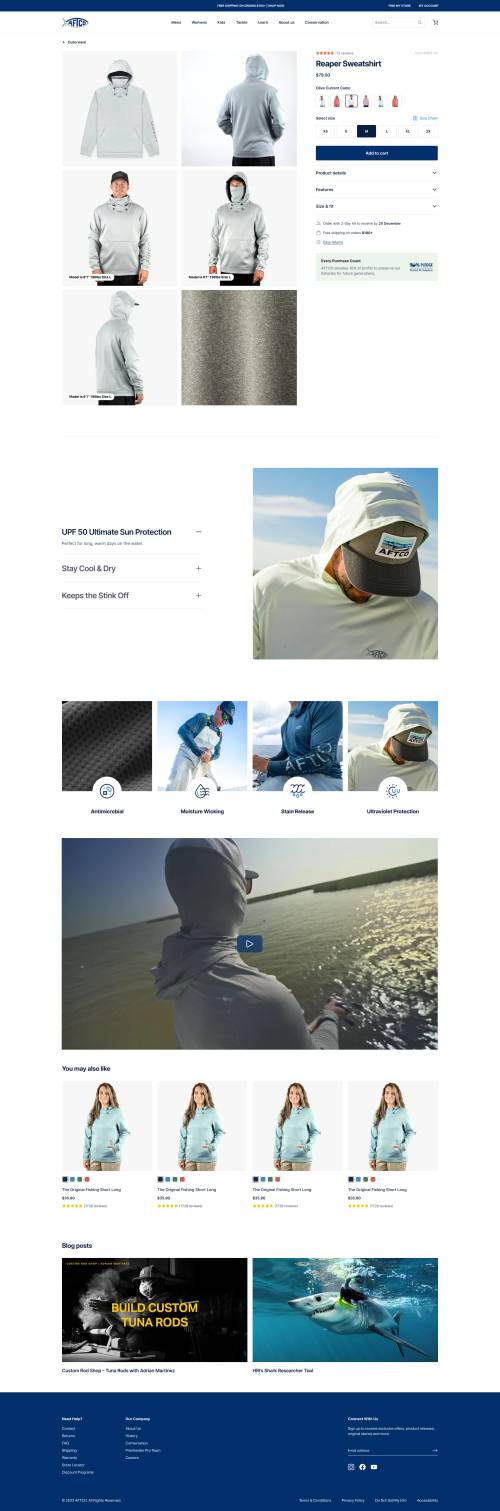
Enhancing Trust and Clarity on PDP
The Product Detail Page was redesigned by restructuring the top fold, adding testimonials, and including a "How It Works" section. Discover the impact on conversion and engagement metrics.
-10.0% Revenue per visitor (RPV)
Collection Page (PLP)
Inconclusive
Enhanced Collection Pages with Subcategory Cards Boosts User Engagement
Adding category cards at the top of collection pages led to improved navigation and engagement. Discover how this change impacted key metrics.
-2.2% Conversion rate
Product Page (PDP)
Inconclusive
New PDP layout
Discover how restructuring the product page layout impacted conversion rates by surfacing cross-sell products earlier.
+1.4% Conversion rate
Homepage
Winner
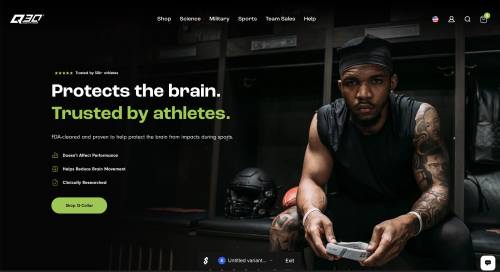
Homepage Hero Benefits
The homepage hero was redesigned to focus on clear benefits, improving user understanding and conversion rates. Discover the impact of this change on user engagement and sales.
+7.7% Conversion rate
Other
Winner
Wishlist feature
Enabling a wishlist feature increased return visits and conversions by simplifying the path to purchase. Discover how this change impacted key metrics.
+4.2% Conversion rate
Product Page (PDP)
Winner
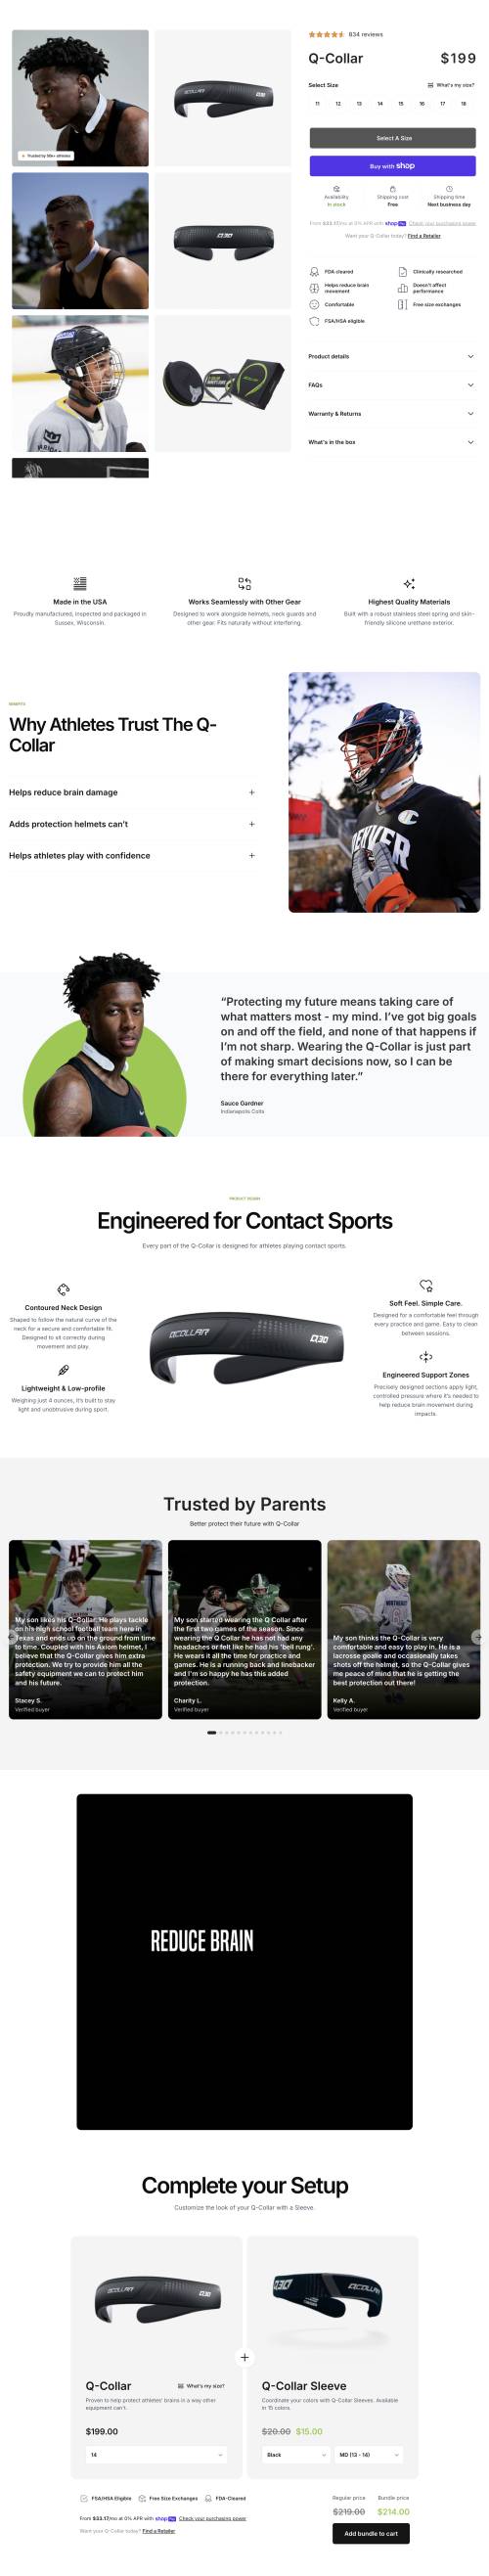
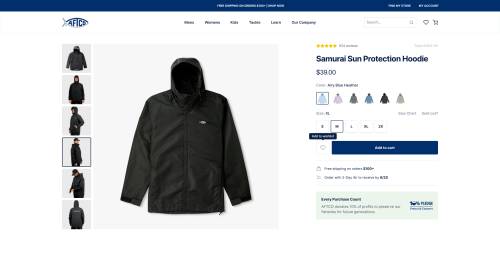
Simplified Product Detail Page
AFTCO restructured its Product Detail Page to improve scannability and engagement. Discover how these changes impacted key business metrics.
+15.7% Conversion rate
Collection Page (PLP)
Winner
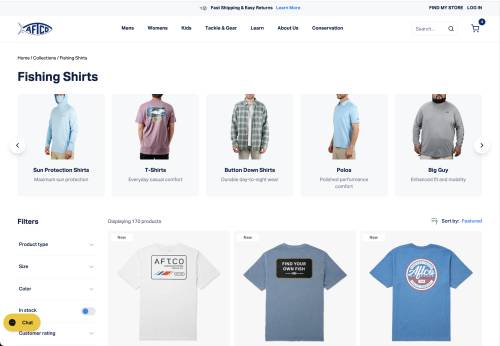
Enhanced collection filters
We redesigned the filter system to improve user navigation and increase conversions. Learn how these changes impacted key metrics.
+8.7% Conversion rate
Product Page (PDP)
Loss Prevented
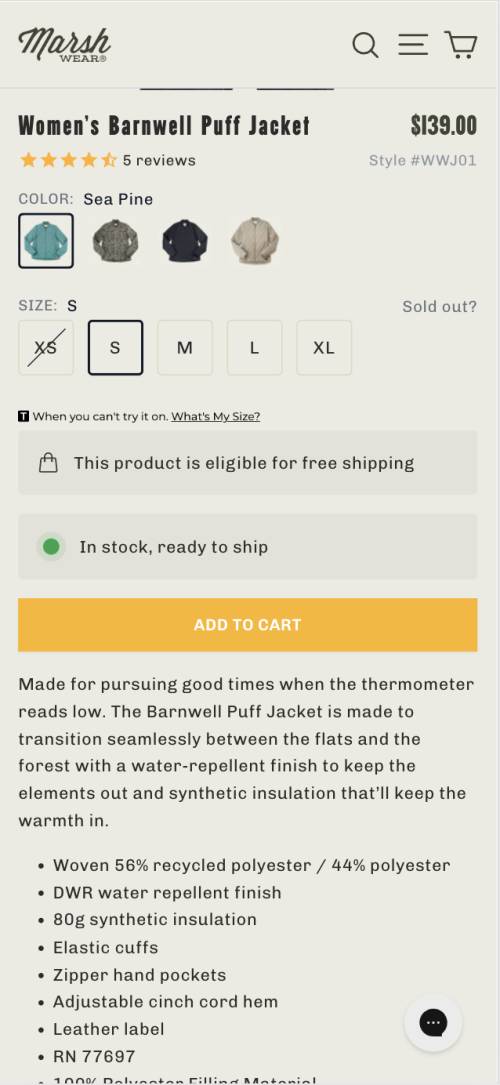
Context-aware shipping message
Marsh Wear tested a refined free shipping message on product pages. Learn how this change affected conversion rates and site behavior.
-5.5% Conversion rate
Homepage
Winner
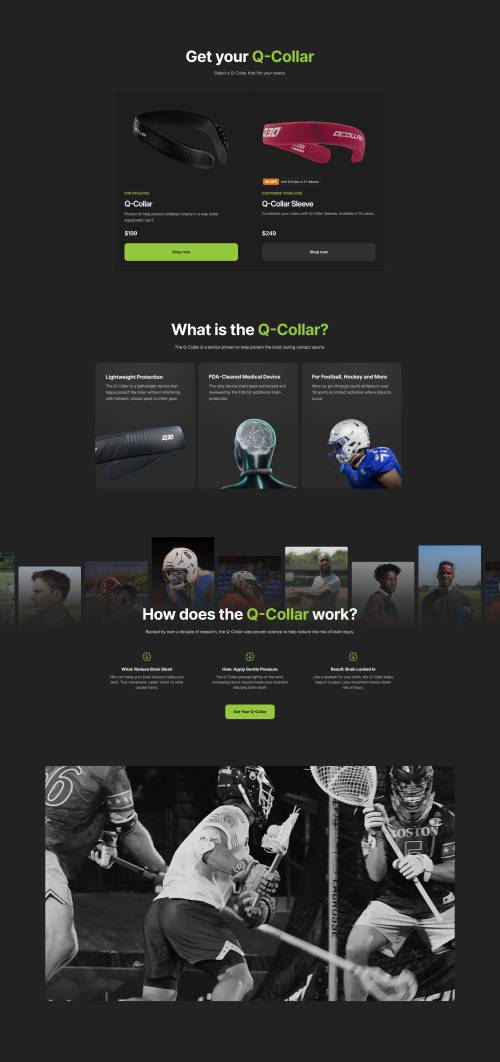
Enhanced Homepage "How It Works" Section
A new homepage section combining athlete's imagery and product explanations boosted mobile conversions. Discover the changes and results.
-3.5% Conversion rate
Product Page (PDP)
Inconclusive
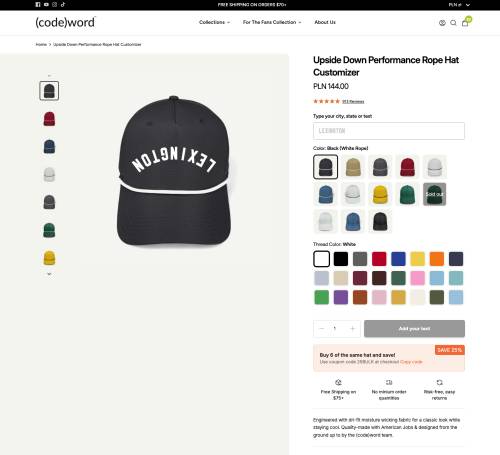
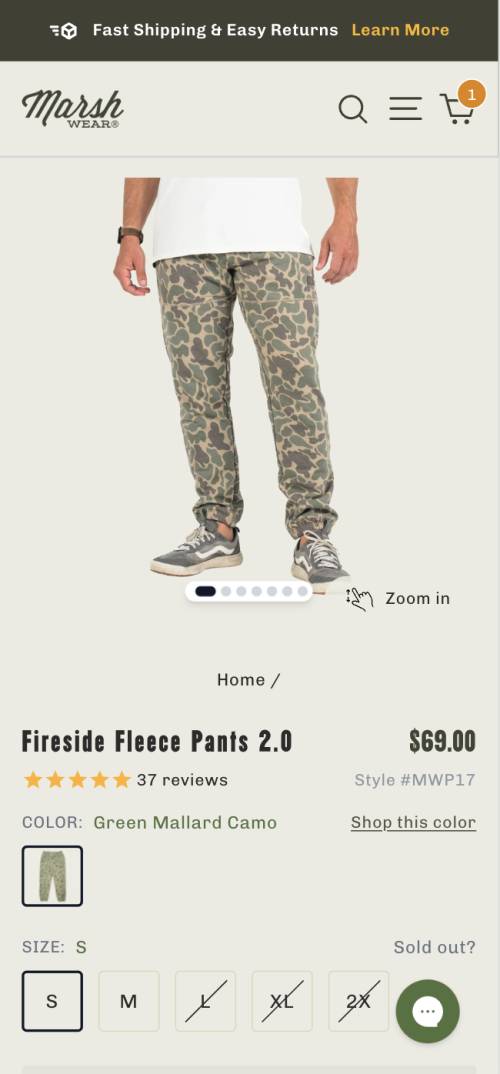
Add a "Shop This Color" Button to PDPs
Adding a “Shop This Color” button on product pages aimed to boost engagement with color-related products. Discover how this change impacted user behavior and sales metrics.
+2.6% Clickthrough rate