A/B Experiments
See the Tests That Generated $7.3M+ in Revenue
Explore real A/B tests and conversion experiments run for Shopify stores across multiple industries. Every test shown here includes actual data, implementation details, and measurable outcomes—no theoretical advice, just proven results.
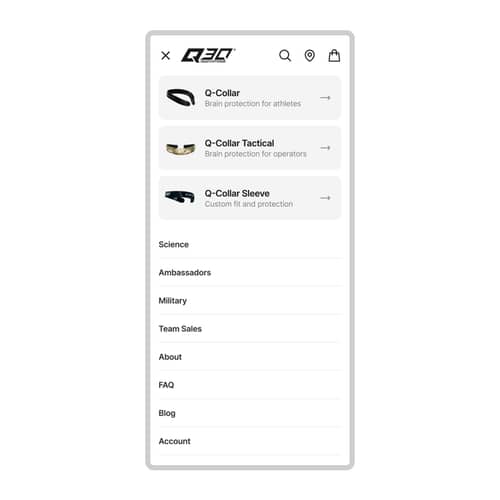
Search & Navigation
Winner
Streamlined mobile navigation
A redesign of the navigation enhanced product discovery boosting key performance metrics. Discover the impact on user engagement and conversion rates.
+19.2% Conversion rate
Collection Page (PLP)
Winner
Enhanced Navigation Clarity with Breadcrumbs on Collection Pages
Adding breadcrumbs to collection pages improved navigation and boosted user engagement. Learn how this change impacted key metrics.
+1.8% Conversion rate
Collection Page (PLP)
Winner
Adding "New" badges across product listings
Adding a "New" badge to products increased user interactions and conversions. Discover the impact of this simple change.
+1.8% Clickthrough rate
Homepage
Winner
Homepage Recommendations Layout Redesign
We tested a new layout for product recommendations on the homepage to increase user engagement. Discover the impact of these changes on key performance metrics.
+1.5% Clickthrough rate
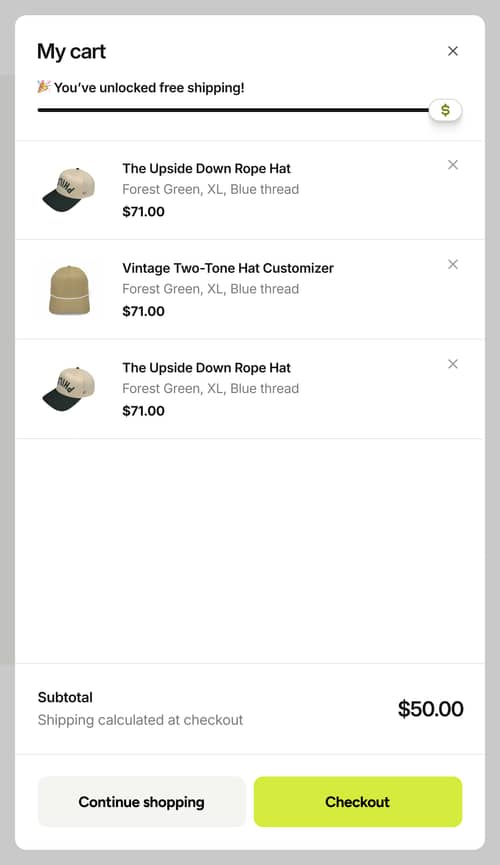
Cart
Loss Prevented
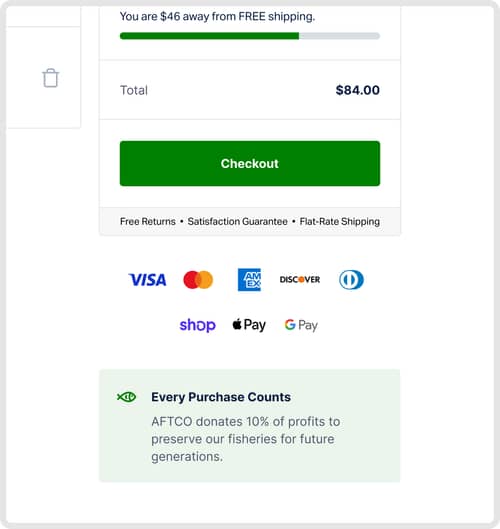
Visual free shipping progress indicator
A visual indicator was added to the minicart to show how close users are to free shipping. Discover how this change impacted user behavior and average order value.
-5.9% Conversion rate
Other
Winner
Highlighting AFTCO’s conservation pledge
Discover how integrating conservation-focused icons and messaging impacted customer engagement and conversion rates on AFTCO’s website.
+5.0% Revenue per visitor (RPV)
Search & Navigation
Winner
Implementing a Sticky Navbar
Implementing a sticky navigation bar improved navigation ease and engagement. Learn how this change impacted user behavior and key metrics.
+0.5% Clickthrough rate
Collection Page (PLP)
Inconclusive
Enhanced Product Cards Drive User Engagement and Conversion Improvements
AFTCO tested a new design for product cards to boost user engagement and conversions. Discover the impact of simplifying their layout.
+0.6% Conversion rate
Product Page (PDP)
Winner
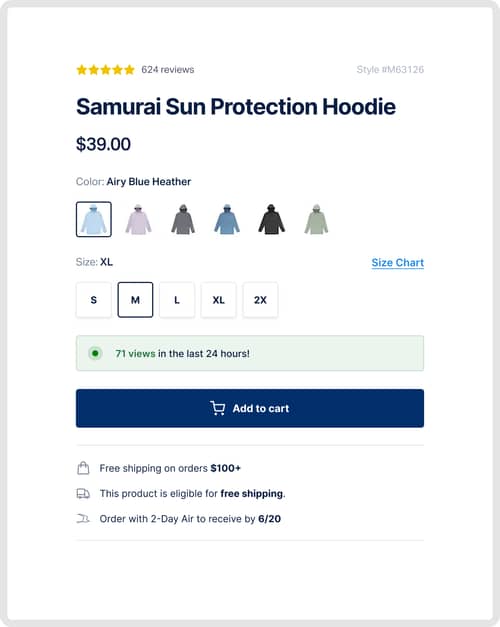
Adding Free Shipping Message Boosts Conversion and Revenue on Product Pages
Adding a "This product is eligible for free shipping" message on the product detail page increased purchase confidence and improved conversion rates. Learn how this change impacted customer behavior.
+21.0% Conversion rate
Other
Winner
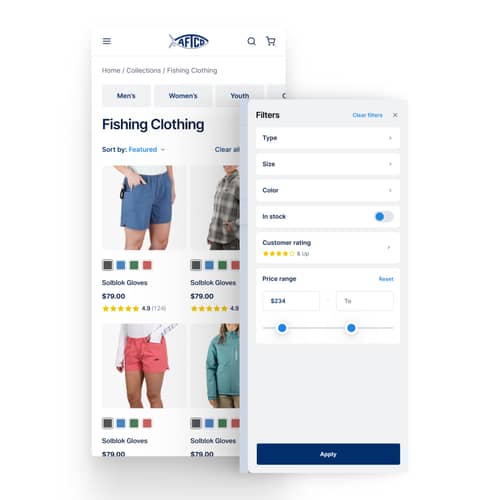
Enhanced mobile filters increase conversions and revenue
Adding Klaviyo's tracking script to the header increased conversion rates and revenue. Discover the impact of this simple code addition.
+5.0% Conversion rate
Homepage
Inconclusive
Science-backed Summary
Added a summary of scientific findings to the homepage to reduce bounce rates and increase product page clicks.
-12.4% Conversion rate
Collection Page (PLP)
Loss Prevented
Enhanced Product Cards
Discover how redesigning product cards impacted user engagement and conversion rates. Learn about the changes and key insights from the test.
-1.0% Conversion rate