A/B Experiments
See the Tests That Generated $7.3M+ in Revenue
Explore real A/B tests and conversion experiments run for Shopify stores across multiple industries. Every test shown here includes actual data, implementation details, and measurable outcomes—no theoretical advice, just proven results.

Collection Page (PLP)
Loss Prevented
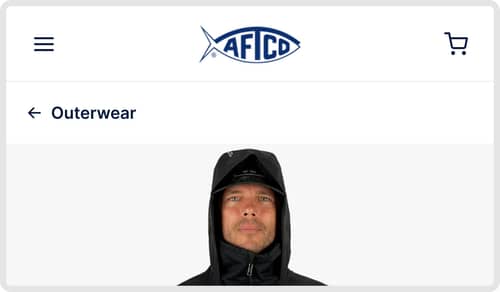
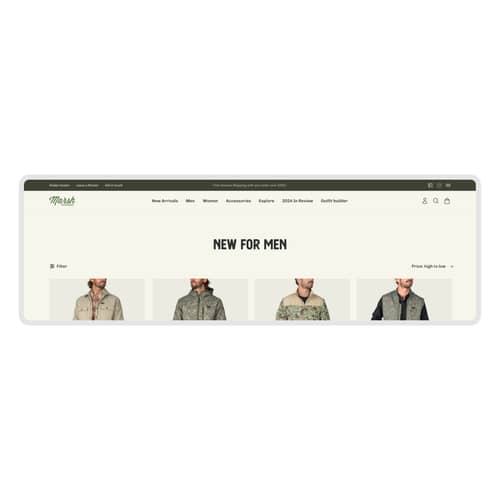
Redesigned square product cards boost mobile engagement despite mixed performance metrics
The redesign of AFTCO's product cards aimed to enhance user engagement and conversions by simplifying the layout and optimizing space. Discover the impact of these changes.
-5.64% (CVR) CVR
Product Page (PDP)
Inconclusive
Adding Category Links on Product Pages
Adding a product category link on product pages increased product discovery and improved certain engagement metrics. Discover the detailed outcomes and insights from this test.
+8.7% Clickthrough rate
Search & Navigation
Winner
Mobile Menu Redesign
The mobile menu redesign led to improved customer navigation, resulting in increased conversion rates and revenue. Discover the impact of visual collection displays on user engagement.
+10.3% Conversion rate

Product Page (PDP)
Loss Prevented
Redesigned Product Page Enhances Visuals and User Engagement
The product page was redesigned to improve visuals and engagement. Learn how these changes impacted conversion rates and user behavior.
-16.3% Conversion rate

Collection Page (PLP)
Inconclusive
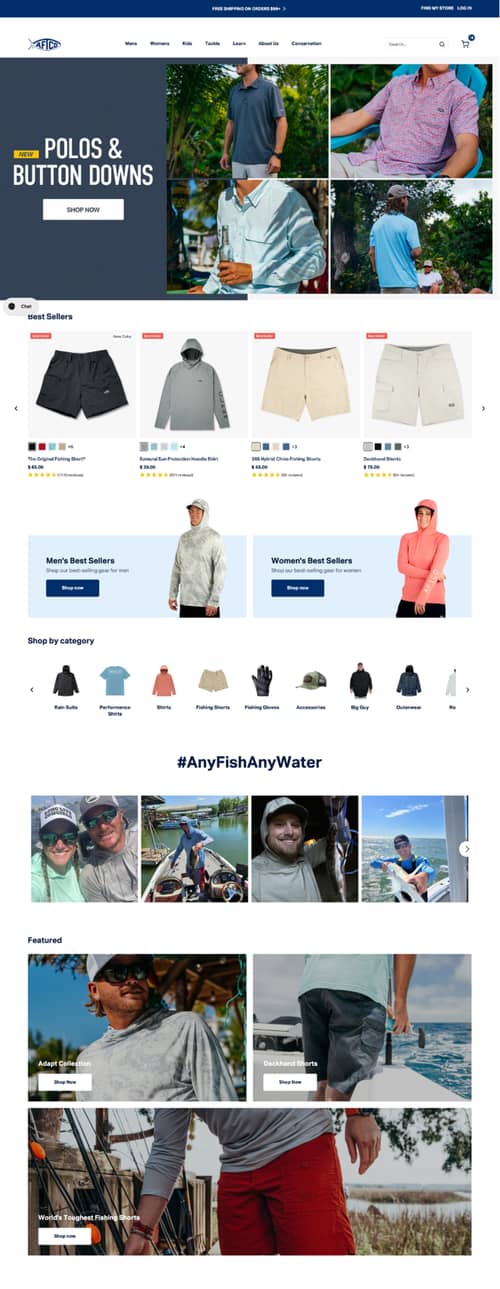
Collection pages redesign with improved visuals and navigation boosts desktop revenue and engagement
Discover how redesigning collection pages with better visuals impacted user engagement and conversions.
-2.36% (CVR) CVR
Collection Page (PLP)
Winner
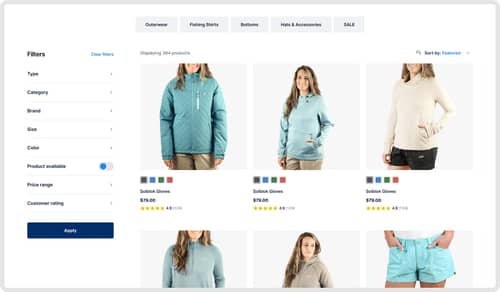
Two-Column Filters Layout
A new layout with a left sidebar for filters improved user engagement and conversion rates. Discover how these changes impacted the browsing experience.
+7.6% Add-to-cart rate
Homepage
Inconclusive
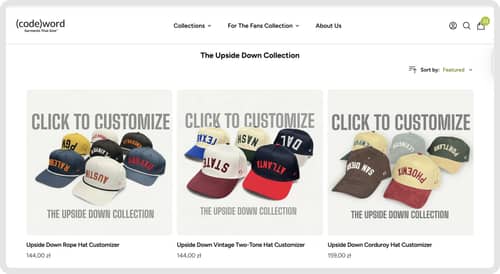
Homepage product cards with swatches improve engagement and conversions
An A/B test was conducted to enhance the desktop click-through rate for Codeword Hats. Discover how adjustments led to increased engagement.
-0.6% Conversion rate
Search & Navigation
Winner
Navbar Redesign with Banner Color Testing
Improving the navbar layout and testing banner colors led to improved user engagement. Learn how these changes impacted key metrics.
+18.4% Add-to-cart rate
Collection Page (PLP)
Winner
Collection Page Redesign
We tested a new design for product pages to improve user engagement and sales. Discover the impact on key metrics.
+4.2% Conversion rate
Homepage
Winner
Adding Customer UGC to Homepage
Adding a user-generated content block to the homepage showcased real customer experiences and improved engagement. Discover how this change impacted key performance metrics.
+2.1% Clickthrough rate
Product Page (PDP)
Winner
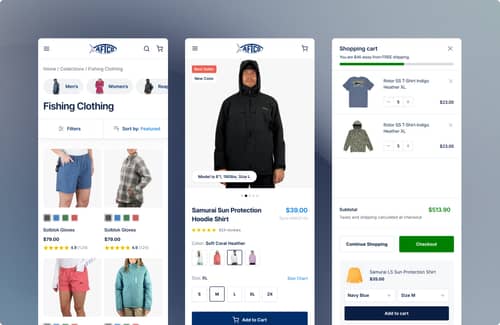
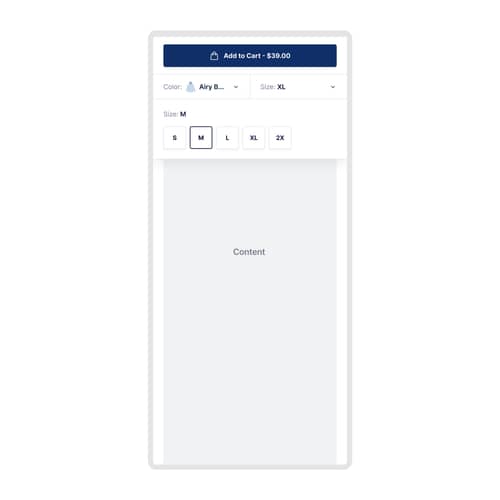
Top Mobile Sticky Add-To-Cart
Discover how moving the sticky "Add to Cart" button to the top of the page impacted user engagement and sales metrics.
+16.4% Conversion rate
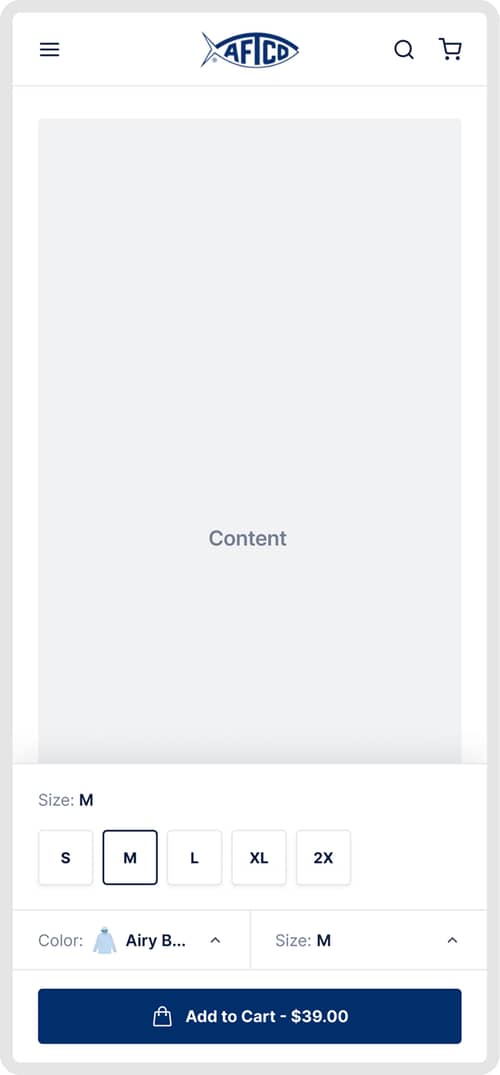
Product Page (PDP)
Winner
Sticky Mobile Add-To-Cart Button
AFTCO tested a sticky mobile add to cart button to increase add-to-cart rates. Learn how this change impacted user behavior.
+3.9% Add-to-cart rate